

The RalB-RLIP76 complex reveals a novel mode of ral-effector interaction
- PMID: 20696399
- PMCID: PMC4214634
- DOI: 10.1016/j.str.2010.05.013
The RalB-RLIP76 complex reveals a novel mode of ral-effector interaction
Abstract
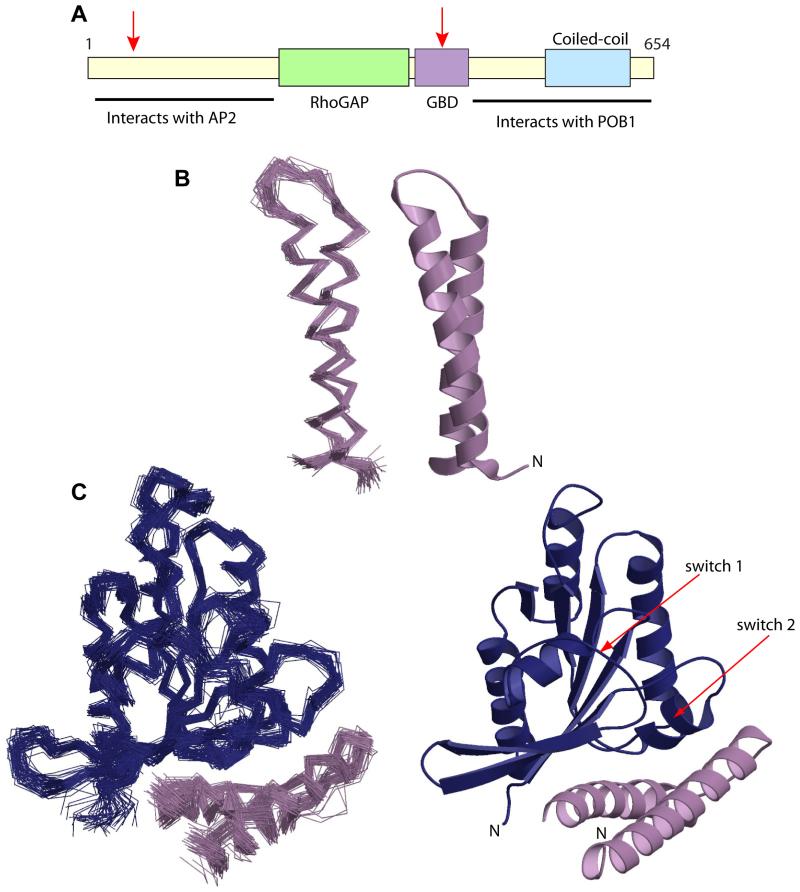
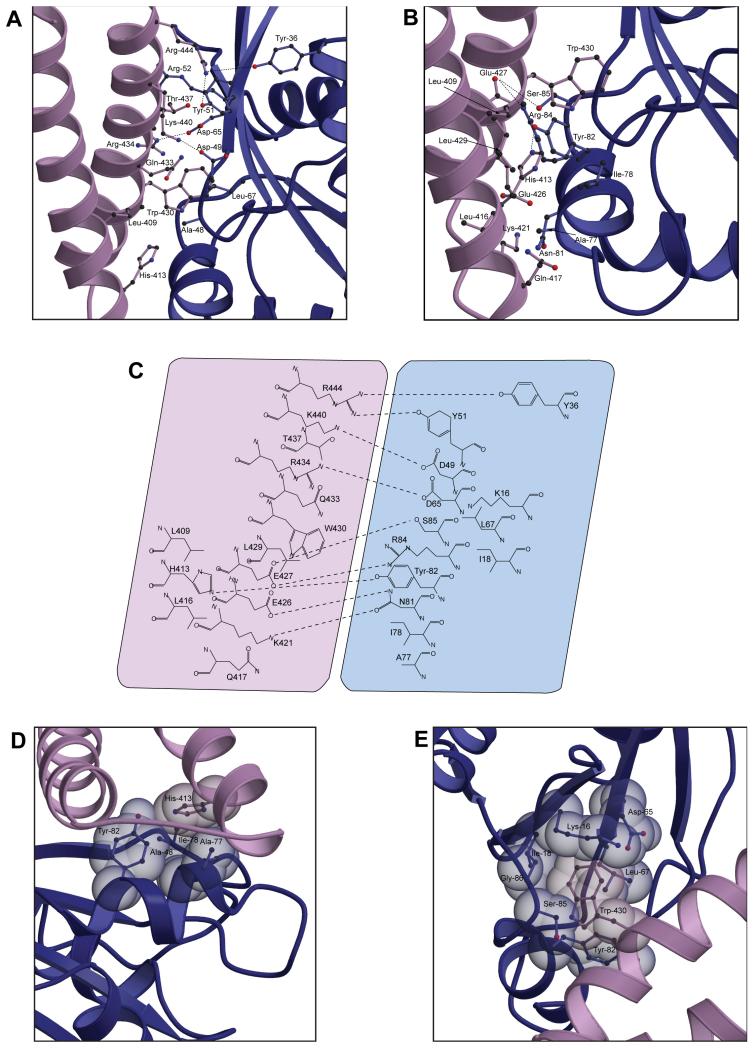
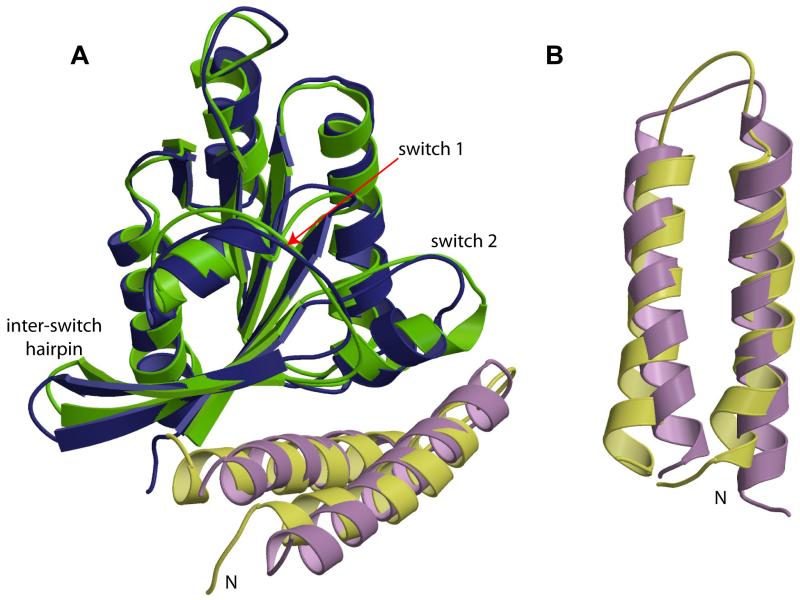
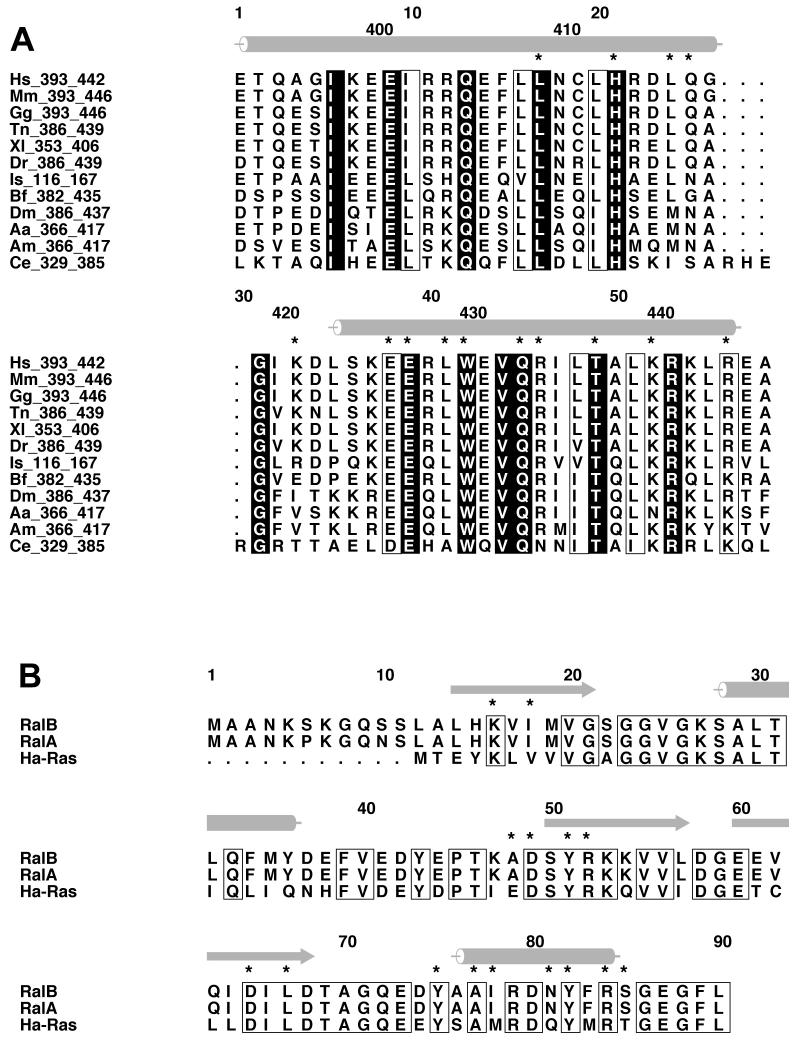
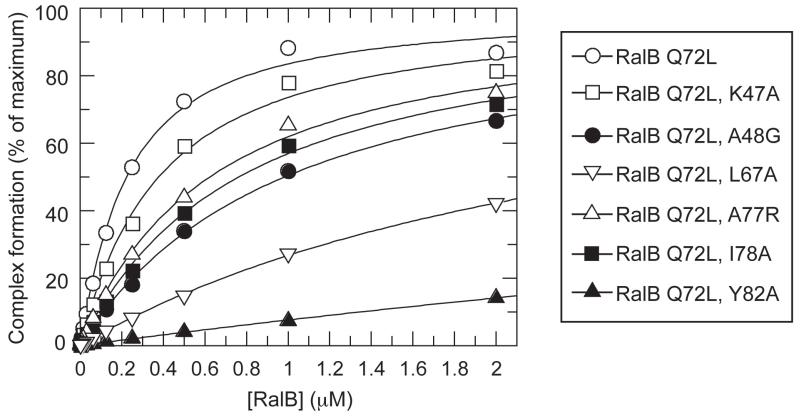
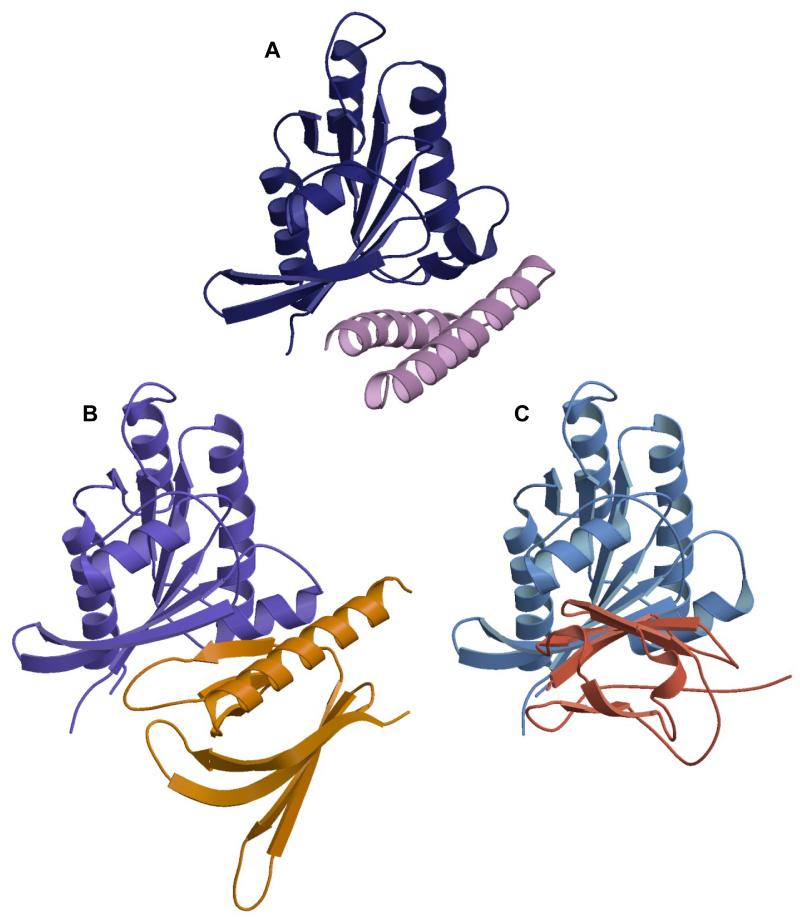
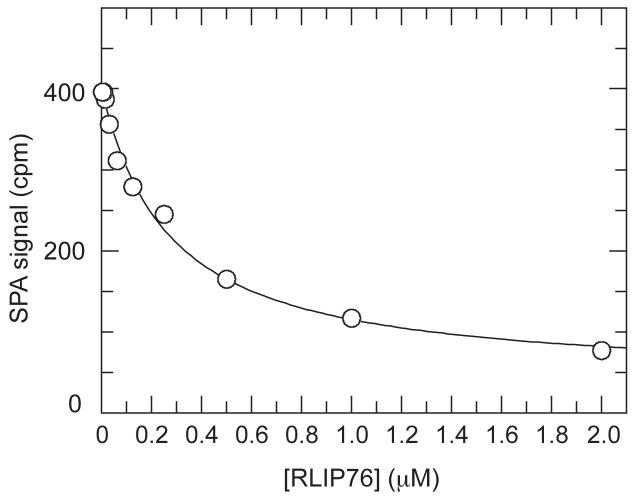
RLIP76 (RalBP1) is a multidomain protein that interacts with multiple small G protein families: Ral via a specific binding domain, and Rho and R-Ras via a GTPase activating domain. RLIP76 interacts with endocytosis proteins and has also been shown to behave as a membrane ATPase that transports chemotherapeutic agents from the cell. We have determined the structure of the Ral-binding domain of RLIP76 and show that it comprises a coiled-coil motif. The structure of the RLIP76-RalB complex reveals a novel mode of binding compared to the structures of RalA complexed with the exocyst components Sec5 and Exo84. RLIP76 interacts with both nucleotide-sensitive regions of RalB, and key residues in the interface have been identified using affinity measurements of RalB mutants. Sec5, Exo84, and RLIP76 bind Ral proteins competitively and with similar affinities in vitro.
Copyright 2010 Elsevier Ltd. All rights reserved.
Figures
Similar articles
-
The structure of the RLIP76 RhoGAP-Ral binding domain dyad: fixed position of the domains leads to dual engagement of small G proteins at the membrane.Structure. 2013 Dec 3;21(12):2131-42. doi: 10.1016/j.str.2013.09.007. Epub 2013 Oct 24. Structure. 2013. PMID: 24207123 Free PMC article.
-
Ral GTPases in tumorigenesis: emerging from the shadows.Exp Cell Res. 2013 Sep 10;319(15):2337-42. doi: 10.1016/j.yexcr.2013.06.020. Epub 2013 Jul 2. Exp Cell Res. 2013. PMID: 23830877 Free PMC article. Review.
-
Thermodynamic mapping of effector protein interfaces with RalA and RalB.Biochemistry. 2015 Feb 17;54(6):1380-9. doi: 10.1021/bi501530u. Epub 2015 Feb 5. Biochemistry. 2015. PMID: 25621740
-
1H, 13C and 15N resonance assignments for the active conformation of the small G protein RalB in complex with its effector RLIP76.Biomol NMR Assign. 2008 Dec;2(2):179-82. doi: 10.1007/s12104-008-9115-7. Epub 2008 Oct 19. Biomol NMR Assign. 2008. PMID: 19636899
-
The non-ABC drug transporter RLIP76 (RALBP-1) plays a major role in the mechanisms of drug resistance.Curr Drug Metab. 2007 May;8(4):315-23. doi: 10.2174/138920007780655414. Curr Drug Metab. 2007. PMID: 17504221 Review.
Cited by
-
The RAL Enigma: Distinct Roles of RALA and RALB in Cancer.Cells. 2022 May 14;11(10):1645. doi: 10.3390/cells11101645. Cells. 2022. PMID: 35626682 Free PMC article. Review.
-
Ral small GTPase signaling and oncogenesis: More than just 15minutes of fame.Biochim Biophys Acta. 2014 Dec;1843(12):2976-2988. doi: 10.1016/j.bbamcr.2014.09.004. Epub 2014 Sep 16. Biochim Biophys Acta. 2014. PMID: 25219551 Free PMC article. Review.
-
The structure of the RLIP76 RhoGAP-Ral binding domain dyad: fixed position of the domains leads to dual engagement of small G proteins at the membrane.Structure. 2013 Dec 3;21(12):2131-42. doi: 10.1016/j.str.2013.09.007. Epub 2013 Oct 24. Structure. 2013. PMID: 24207123 Free PMC article.
-
The deubiquitylase USP33 discriminates between RALB functions in autophagy and innate immune response.Nat Cell Biol. 2013 Oct;15(10):1220-30. doi: 10.1038/ncb2847. Epub 2013 Sep 22. Nat Cell Biol. 2013. PMID: 24056301
-
Ral GTPases in tumorigenesis: emerging from the shadows.Exp Cell Res. 2013 Sep 10;319(15):2337-42. doi: 10.1016/j.yexcr.2013.06.020. Epub 2013 Jul 2. Exp Cell Res. 2013. PMID: 23830877 Free PMC article. Review.
References
-
- Awasthi S, Cheng JZ, Singhal SS, Pandya U, Sharma R, Singh SV, Zimniak P, Awasthi YC. Functional reassembly of ATP-dependent xenobiotic transport by the N- and C-terminal domains of RLIP76 and identification of ATP binding sequences. Biochemistry. 2001;40:4159–4168. - PubMed
-
- Awasthi S, Sharma R, Yang YS, Singhal SS, Pikula S, Bandorowicz-Pikula J, Singh SV, Zimniak P, Awasthi YC. Transport functions and physiological significance of 76 kDa Ral-binding GTPase activating protein (RLIP76) Acta Biochim Pol. 2002;49:855–867. - PubMed
-
- Bauer B, Mirey G, Vetter IR, Garcia-Ranea JA, Valencia A, Wittinghofer A, Camonis JH, Cool RH. Effector recognition by the small GTP-binding proteins Ras and Ral. J. Biol. Chem. 1999;274:17763–17770. - PubMed
-
- Brunger AT, Adams PD, Clore GM, DeLano WL, Gros P, Grosse-Kunstleve RW, Jiang JS, Kuszewski J, Nilges M, Pannu NS, et al. Crystallography & NMR system: A new software suite for macromolecular structure determination. Acta Crystallogr. Sect. D-Biol. Crystallogr. 1998;54:905–921. - PubMed
Publication types
MeSH terms
Substances
Associated data
- Actions
- Actions
Grants and funding
LinkOut - more resources
Full Text Sources
Molecular Biology Databases
Miscellaneous
