

MICU1 encodes a mitochondrial EF hand protein required for Ca(2+) uptake
- PMID: 20693986
- PMCID: PMC2977980
- DOI: 10.1038/nature09358
MICU1 encodes a mitochondrial EF hand protein required for Ca(2+) uptake
Abstract
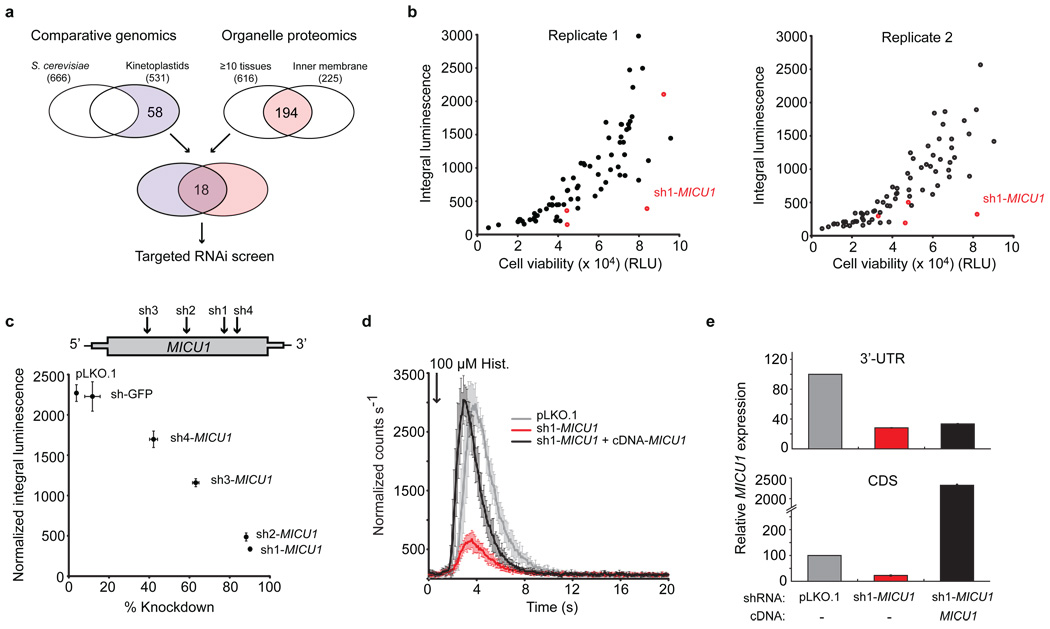
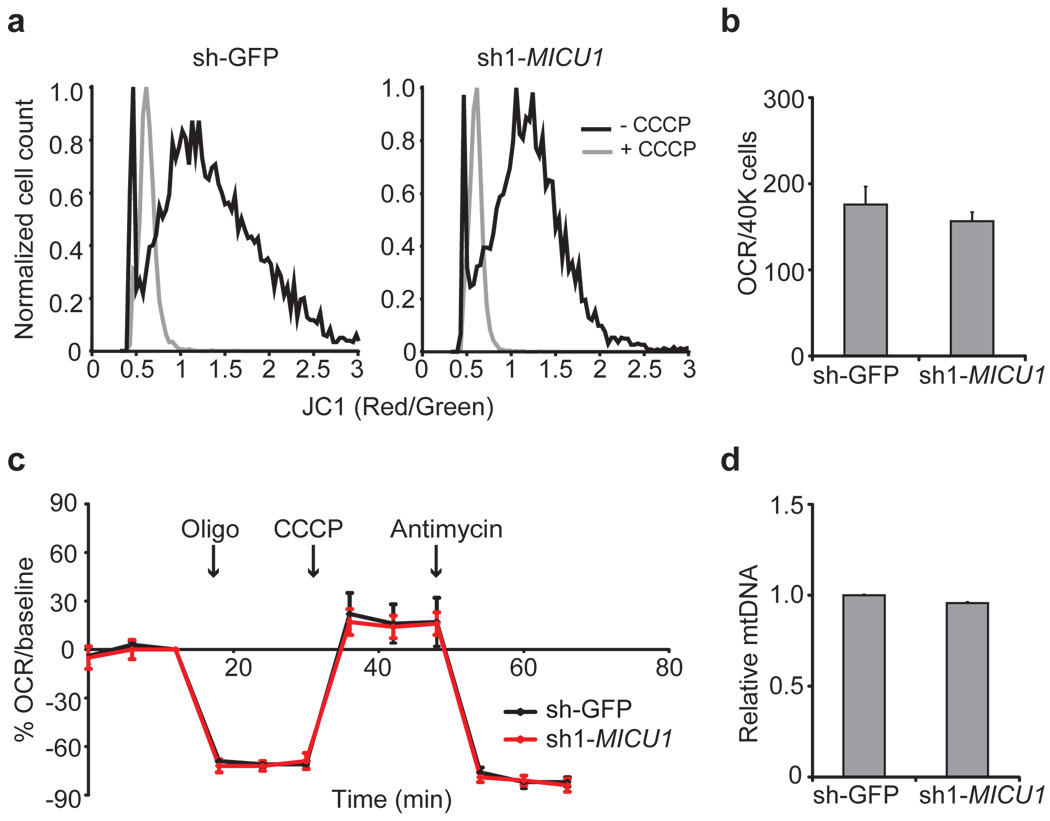
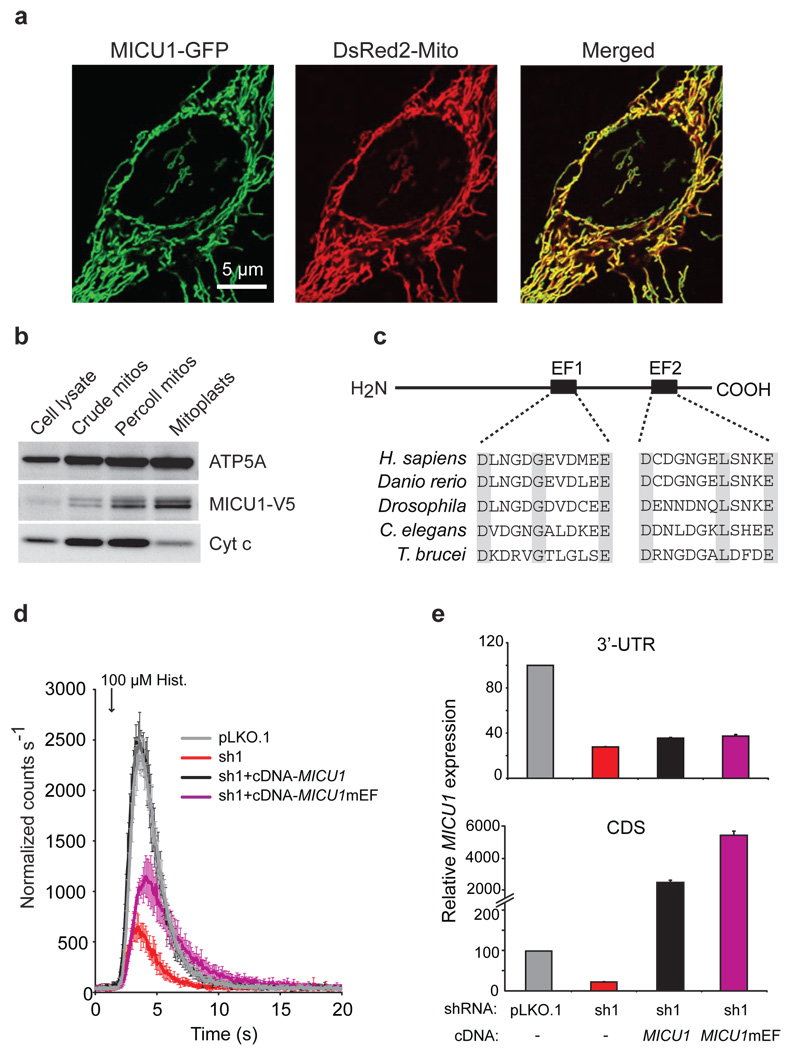
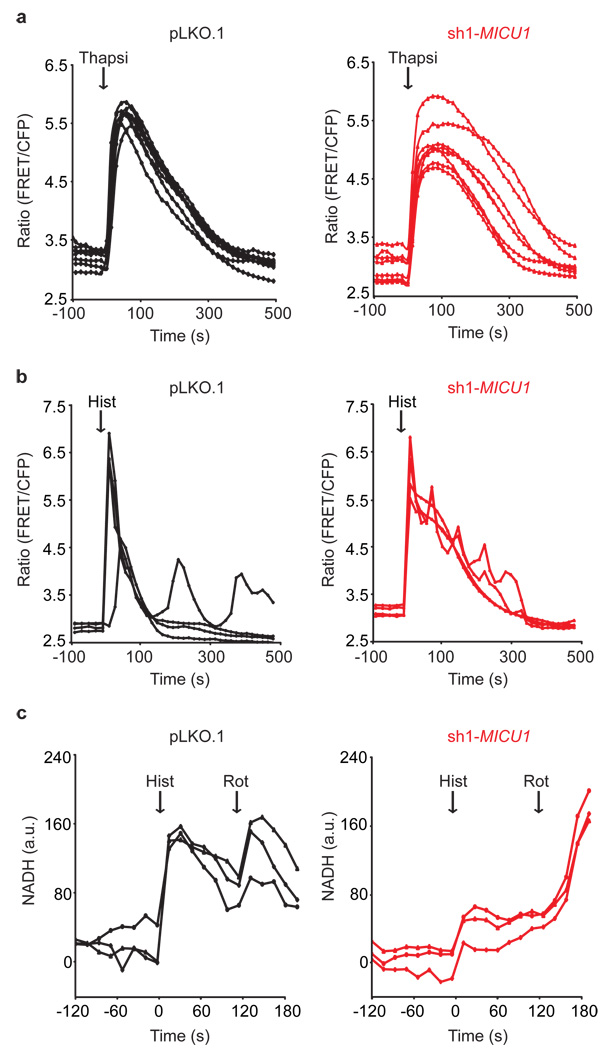
Mitochondrial calcium uptake has a central role in cell physiology by stimulating ATP production, shaping cytosolic calcium transients and regulating cell death. The biophysical properties of mitochondrial calcium uptake have been studied in detail, but the underlying proteins remain elusive. Here we use an integrative strategy to predict human genes involved in mitochondrial calcium entry based on clues from comparative physiology, evolutionary genomics and organelle proteomics. RNA interference against 13 top candidates highlighted one gene, CBARA1, that we call hereafter mitochondrial calcium uptake 1 (MICU1). Silencing MICU1 does not disrupt mitochondrial respiration or membrane potential but abolishes mitochondrial calcium entry in intact and permeabilized cells, and attenuates the metabolic coupling between cytosolic calcium transients and activation of matrix dehydrogenases. MICU1 is associated with the mitochondrial inner membrane and has two canonical EF hands that are essential for its activity, indicating a role in calcium sensing. MICU1 represents the founding member of a set of proteins required for high-capacity mitochondrial calcium uptake. Its discovery may lead to the complete molecular characterization of mitochondrial calcium uptake pathways, and offers genetic strategies for understanding their contribution to normal physiology and disease.
Figures

Comment in
-
Cell biology: A sensor for calcium uptake.Nature. 2010 Sep 16;467(7313):283. doi: 10.1038/467283a. Nature. 2010. PMID: 20844529 Free PMC article.
Similar articles
-
Cell biology: A sensor for calcium uptake.Nature. 2010 Sep 16;467(7313):283. doi: 10.1038/467283a. Nature. 2010. PMID: 20844529 Free PMC article.
-
SLC25A23 augments mitochondrial Ca²⁺ uptake, interacts with MCU, and induces oxidative stress-mediated cell death.Mol Biol Cell. 2014 Mar;25(6):936-47. doi: 10.1091/mbc.E13-08-0502. Epub 2014 Jan 15. Mol Biol Cell. 2014. PMID: 24430870 Free PMC article.
-
Leucine zipper EF hand-containing transmembrane protein 1 (Letm1) and uncoupling proteins 2 and 3 (UCP2/3) contribute to two distinct mitochondrial Ca2+ uptake pathways.J Biol Chem. 2011 Aug 12;286(32):28444-55. doi: 10.1074/jbc.M111.244517. Epub 2011 May 25. J Biol Chem. 2011. PMID: 21613221 Free PMC article.
-
MICU1's calcium sensing beyond mitochondrial calcium uptake.Biochim Biophys Acta Mol Cell Res. 2024 Jun;1871(5):119714. doi: 10.1016/j.bbamcr.2024.119714. Epub 2024 Mar 29. Biochim Biophys Acta Mol Cell Res. 2024. PMID: 38555977 Review.
-
Reliance of ER-mitochondrial calcium signaling on mitochondrial EF-hand Ca2+ binding proteins: Miros, MICUs, LETM1 and solute carriers.Curr Opin Cell Biol. 2014 Aug;29:133-41. doi: 10.1016/j.ceb.2014.06.002. Epub 2014 Jul 10. Curr Opin Cell Biol. 2014. PMID: 24999559 Free PMC article. Review.
Cited by
-
Structural insights into the Ca2+-dependent gating of the human mitochondrial calcium uniporter.Elife. 2020 Aug 7;9:e60513. doi: 10.7554/eLife.60513. Elife. 2020. PMID: 32762847 Free PMC article.
-
Expression and preliminary characterization of human MICU2.Biol Open. 2016 Jul 15;5(7):962-9. doi: 10.1242/bio.018572. Biol Open. 2016. PMID: 27334695 Free PMC article.
-
Maternally inherited mitochondrial respiratory disorders: from pathogenetic principles to therapeutic implications.Mol Genet Metab. 2020 Sep-Oct;131(1-2):38-52. doi: 10.1016/j.ymgme.2020.06.011. Epub 2020 Jun 27. Mol Genet Metab. 2020. PMID: 32624334 Free PMC article. Review.
-
Mitochondrial protein dysfunction in pathogenesis of neurological diseases.Front Mol Neurosci. 2022 Sep 7;15:974480. doi: 10.3389/fnmol.2022.974480. eCollection 2022. Front Mol Neurosci. 2022. PMID: 36157077 Free PMC article. Review.
-
PRMT1-mediated methylation of MICU1 determines the UCP2/3 dependency of mitochondrial Ca(2+) uptake in immortalized cells.Nat Commun. 2016 Sep 19;7:12897. doi: 10.1038/ncomms12897. Nat Commun. 2016. PMID: 27642082 Free PMC article.
References
-
- Vasington FD, Murphy JV. Ca ion uptake by rat kidney mitochondria and its dependence on respiration and phosphorylation. J Biol Chem. 1962;237:2670–2677. - PubMed
-
- Rizzuto R, Simpson AW, Brini M, Pozzan T. Rapid changes of mitochondrial Ca2+ revealed by specifically targeted recombinant aequorin. Nature. 1992;358:325–327. - PubMed
-
- Filippin L, Magalhaes PJ, Di Benedetto G, Colella M, Pozzan T. Stable interactions between mitochondria and endoplasmic reticulum allow rapid accumulation of calcium in a subpopulation of mitochondria. J Biol Chem. 2003;278:39224–39234. - PubMed
-
- Palmer AE, et al. Ca2+ indicators based on computationally redesigned calmodulin-peptide pairs. Chem Biol. 2006;13:521–530. - PubMed
Publication types
MeSH terms
Substances
Grants and funding
- R01 GM077465-06/GM/NIGMS NIH HHS/United States
- R01 GM077465-04/GM/NIGMS NIH HHS/United States
- R24 DK080261-04/DK/NIDDK NIH HHS/United States
- HHMI/Howard Hughes Medical Institute/United States
- R24 DK080261/DK/NIDDK NIH HHS/United States
- R01 GM084027/GM/NIGMS NIH HHS/United States
- TR2 GM08759/GM/NIGMS NIH HHS/United States
- T32 GM142607/GM/NIGMS NIH HHS/United States
- R01 GM077465-03/GM/NIGMS NIH HHS/United States
- R01 GM077465-01A1/GM/NIGMS NIH HHS/United States
- DK080261/DK/NIDDK NIH HHS/United States
- R01 GM077465-02/GM/NIGMS NIH HHS/United States
- R01 GM077465/GM/NIGMS NIH HHS/United States
- GM084027/GM/NIGMS NIH HHS/United States
- T32 GM008759/GM/NIGMS NIH HHS/United States
- GM0077465/GM/NIGMS NIH HHS/United States
- R01 GM077465-05/GM/NIGMS NIH HHS/United States
LinkOut - more resources
Full Text Sources
Other Literature Sources
Molecular Biology Databases
Research Materials
Miscellaneous
