. 2010 Oct 14;29(41):5619-29.
doi: 10.1038/onc.2010.295. Epub 2010 Aug 2.

Adenovirus 5 E1A enhances histone deacetylase inhibitors-induced apoptosis through Egr-1-mediated Bim upregulation

Affiliations

Adenovirus 5 E1A enhances histone deacetylase inhibitors-induced apoptosis through Egr-1-mediated Bim upregulation

H Yamaguchi et al. Oncogene. .

Abstract

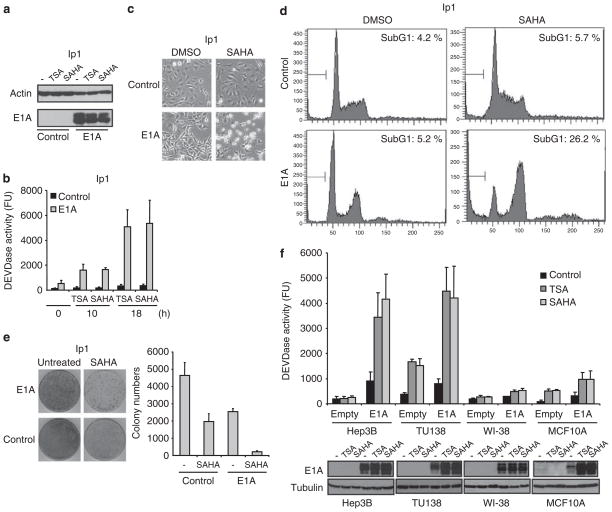
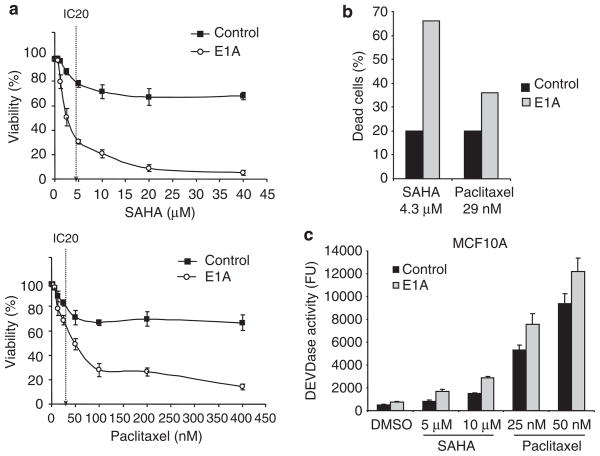
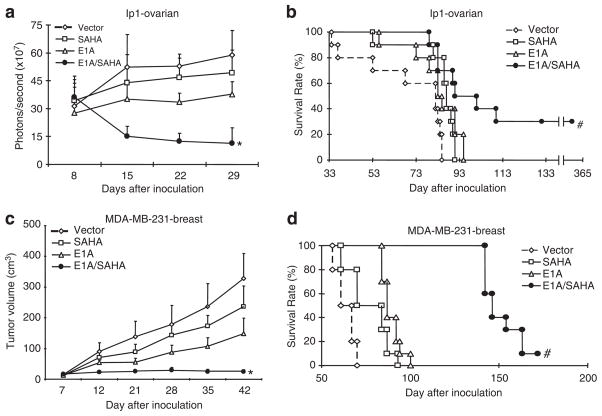
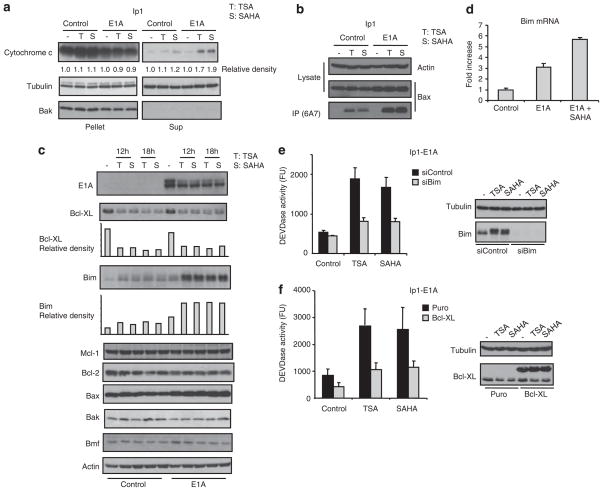
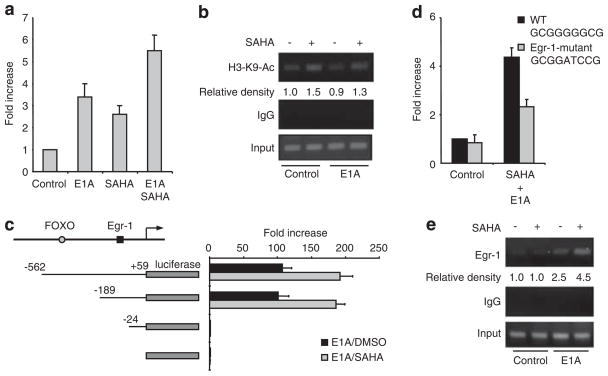
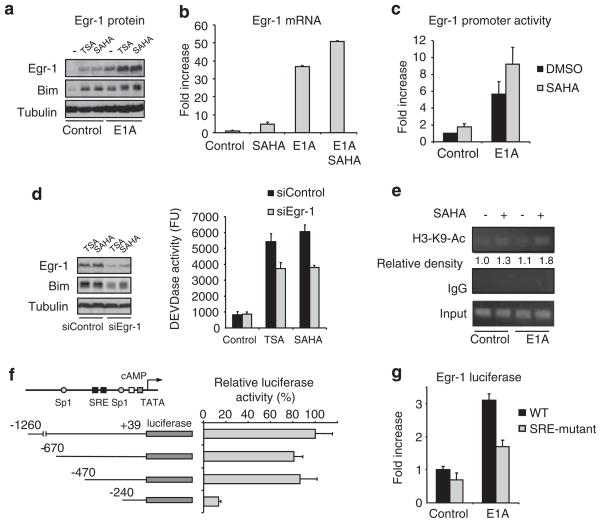
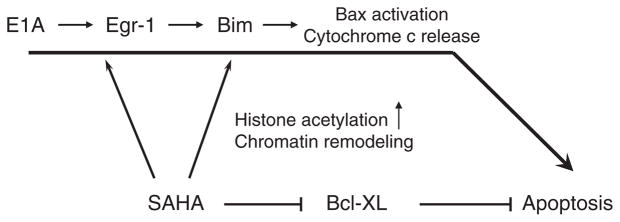
Histone deacetylase inhibitors (HDACi) are potent anti-cancer agents for variety of cancer types. Suberoylanilide hydroxamic acid (SAHA) has been approved as a drug to treat cutaneous T cell lymphoma, and the combination of HDACi and other agents have been actively tested in many clinical trials. Adenovirus 5 early region 1A (E1A) has been shown to exhibit high tumor suppressor activity, and gene therapy using E1A has been tested in clinical trials. Here, we showed that proapoptotic activity of HDACi was robustly enhanced by E1A in multiple cancer cells, but not in normal cells. Moreover, we showed that combination of E1A gene therapy and SAHA showed high therapeutic efficacy with low toxicity in vivo ovarian and breast xenograft models. SAHA downregulated Bcl-XL and upregulated proapoptotic BH3-only protein Bim, whose expression was further enhanced by E1A in cancer cells. These alterations of Bcl-2 family proteins were critical for apoptosis induced by the combination in cancer cells. SAHA enhanced acetylation of histone H3 in Bim promoter region, while E1A upregulated Egr-1, which was directly involved in Bim transactivation. Together, our results provide not only a novel insight into the mechanisms underlying anti-tumor activity of E1A, but also a rationale for the combined HDACi and E1A gene therapy in future clinical trials.


Conflict of interest statement

Conflict of interest

The corresponding author, Dr Mien-Chie Hung, is an inventor on patents covering E1A as a therapeutic agent filed by the University of Texas MD Anderson Cancer. The remaining authors declare no conflict of interest.

Figures

Figure 1
Figure 1
Adenovirus 5 early region 1A (E1A) enhances HDACi-induced cell death in human cancer cells. (a) E1A and actin expression in SKOV3-ip1 control or E1A cells was verified by immunoblot analysis. (b) SKOV3-ip1 control or E1A cells were treated with 250 nM of trichostatin A (TSA) or 5 μM of suberoylanilide hydroxamic acid (SAHA) for the indicated periods, and caspase-3 activity was determined by caspase assay, using a fluorescence substrate. (c) The cellular morphology of SKOV3-ip1 control or E1A cells treated with dimethyl sulfoxide (DMSO) or 5 μM of SAHA for 24 h. (d) SKOV3-ip1 control or E1A cells were treated with DMSO or 5 μM of SAHA for 20 h. The cells were then fixed and stained with propidium iodide, followed by flow cytometric analysis. The percentage of cells with a sub-G1 DNA content is shown within each box. (e) SKOV3-ip1 control or E1A cells were treated with 5 μM of SAHA for 24 h. Cellular sensitivity to SAHA was determined by using the clonogenic survival assay. The colony numbers were counted and shown in the bar graph (n=3). (f) Hep3B, TU138, WI-38 and MCF10A cells were transiently transfected with either empty or E1A expression plasmid and treated with 250 nM of TSA or 5 μM of SAHA for 16 h. Capase-3 activity was then determined by caspase assay using fluorescence substrate. E1A and tubulin expression in these cells was verified by immunoblot analysis.
Figure 2
Figure 2
Adenovirus 5 early region 1A (E1A) enhances suberoylanilide hydroxamic acid (SAHA)-induced cell death more effectively than paclitaxel-induced cell death in cancer cells but not in normal cells. (a) SKOV3-ip1 control or E1A stable cells were treated with the indicated concentrations of SAHA or paclitaxel for 48 h, and viability was determined by the trypan blue dye exclusion assay. IC20 in control cells was indicated as a dotted line. (b) Comparison of cell death of SKOV3 ip1-E1A cells at the drug concentrations that induced 20% cell death (4.3 μM for SAHA and 29 nM for paclitaxel) in SKOV3-ip1 control cells. (c) MCF10A cells were transiently transfected with either empty or E1A expression plasmid and treated with 5 or 10 μM of SAHA or 25 or 50 nM of paclitaxel for 24 h. Caspase-3 activity was then determined by caspase assay using fluorescence substrate.
Figure 3
Figure 3
The combination of adenovirus 5 early region 1A (E1A) and suberoylanilide hydroxamic acid (SAHA) suppresses tumor growth in vivo. (a) Mice bearing SKOV3-ip1-luciferase tumors were treated with vector/liposome (control), E1A/liposome (E1A, 15 μg DNA/mouse), vector/liposome plus SAHA (SAHA 100 mg/kg) or E1A/liposome plus SAHA (E1A/SAHA), and luciferase signals in vivo were monitored. *P<0.01 vs single treatments. (b) Survival curves of animals used in (a). All treatments were terminated at day 31 after inoculation. #P<0.04 vs single treatments. (c) Mice bearing MDA-MB-231 breast tumors were treated with vector/liposome (control), E1A/liposome (E1A, 15 μg DNA/mouse), vector/liposome plus SAHA (SAHA, 100 mg/kg) or E1A/liposome plus SAHA (E1A/SAHA), and tumor sizes were measured. *P<0.01 vs single treatments. (d) Survival curves of animals used in (c). All treatments were terminated at day 31 after inoculation. and #P<0.01 vs single treatments.
Figure 4
Figure 4
The combination of adenovirus 5 early region 1A (E1A) and suberoylanilide hydroxamic acid (SAHA) activates the mitochondrial pathway of apoptosis though upregulating Bim and downregulating Bcl-XL. (ad) SKOV3-ip1 control or E1A cells were treated with 250 nM of trichostatin A (TSA) or 5 μM of SAHA. (a) Sixteen hours after treatment, the cells were subjected to subcellular fractionation to separate the cytosolic and membrane fractions. Each fraction was analyzed by immunoblot analysis with the indicated antibodies. Bak is a mitochondria marker and could not be detected in the cytosolic fraction. (b) Sixteen hours after treatment, the Bax conformational change was determined by immunoprecipitation with anti-Bax 6A7 antibody that recognizes only the active form of Bax. (c) The expressions of the Bcl-2 family proteins were determined by immunoblot analysis with the indicated antibodies. (d) Six hours after treatment, the expressions of Bim mRNA were assessed by quantitative RT–PCR. (e) SKOV3-ip1 E1A cells were transiently transfected with siRNA oligo against Bim or control non-specific siRNA. Thirty-six hours after transfection, the cells were treated with 250 nM of TSA or 5 μM of SAHA for 12 h and subjected to caspase assay. Bim and tubulin expressions are shown in the right panel. (f) SKOV3-ip1 E1A stable cells were stably transfected with myc-tagged Bcl-XL or empty plasmid. The cells were then treated with 250 nM of TSA or 5 μM of SAHA for 14 h and subjected to caspase assay. Bcl-XL and tubulin expressions are shown in the right panel.
Figure 5
Figure 5
Egr-1 binding site in Bim promoter is critical for Bim transactivaiton by the combination of E1A and HDACi. (a) SKOV3-ip1 cells were co-transfected with the Bim-promoter luciferase plasmid together with renilla luciferase expression plasmid (internal control) and E1A expression plasmid/empty vector. Twenty-four hours after transfection, the cells were treated with 5 μM of SAHA for an additional 6 h and subjected to the dual luciferase assay. The luciferase activity is shown relative to that of untreated control transfected with empty vector. (b) SKOV3-ip1 control or E1A cells were treated with SAHA for 6 h, and the chromatin immunoprecipitation (ChIP) assay was performed using control rabbit immunoglobulin G or anti-acetyl-histon H3-K9 antibody. Polymerase chain reaction was performed for Bim promoter. (c) Transactivation of the indicated deletion mutants of Bim promoter-luciferase plasmid in the presence of E1A was determined by dual luciferase activity as mentioned in (a). The luciferase activity is shown relative to that of pGL3 empty luciferase plasmid. (d) Transactivation of wild-type or Egr-1-binding site mutant Bim promoter were determined as mentioned in (a). (e) SKOV3-ip1 control and E1A stable cells were treated or untreated with SAHA for 12 h and subjected to the ChIP assay using Egr-1 antibody or control IgG.
Figure 6
Figure 6
Egr-1 is involved in Bim induction and apoptosis induced by the combination of adenovirus 5 early region 1A (E1A) and histone deacetylase inhibitors (HDACi). (a, b) SKOV3-ip1 control or E1A cells were treated with 250 nM of trichostatin A (TSA) or 5 μM of SAHA for 12 h; Egr-1, Bim and tubulin expressions were determined by immunoblot analysis (a). Bim mRNA expression was determined by quantitative RT–PCR (b). (c) SKOV3-ip1 cells were co-transfected with luciferase plasmid containing Egr-1 promoter together with renilla luciferase expression plasmid (internal control), E1A expression plasmid (E1A) or empty vector (control). Twenty-four hours after transfection, the cells were treated with 5 μM of SAHA for an additional 6 h and subjected to the dual luciferase assay. The luciferase activity is shown relative to that of untreated control transfected with empty vector. (d) SKOV3-ip1-E1A cells were transiently transfected with short interfering RNA oligo against Egr-1 or control non-specific siRNA. Thirty-six hours after transfection, the cells were treated with 250 nM of TSA or 5 μM of SAHA for 16 h and caspase activity was determined by caspase assay. Egr-1, Bim and tubulin expressions were determined by immunoblot analysis. (e) SKOV3-ip1 control or E1A cells were treated with SAHA for 6 h, and the ChIP assay was performed using control rabbit immunoglobulin G or anti-acetyl-H3-K9. Polymerase chain reaction was carried out for Egr-1 promoter. (f) Transactivation of the indicated deletion mutants of Egr-1 promoter-luciferase plasmid in the presence of E1A was determined by dual luciferase activity as mentioned in (c). (g) Transactivation of the wild-type or SRE mutant Egr-1 promoter were determined as mentioned in (c).
Figure 7
Figure 7
The model of apoptosis signaling induced by the combination of adenovirus 5 early region 1A (E1A) and suberoylanilide hydroxamic acid (SAHA). E1A upregulates Bim expression through Egr-1 pathway, whereas SAHA upregulates Bim, as well as Egr-1 expression by enhancing its promoter acetylation. Bcl-XL is downregulated by SAHA. The alterations of Bim and Bcl-XL expression contribute to Bax activation, cytochrome c release and subsequent caspase activation.

Similar articles

Cited by

References

    1. Baek SJ, Wilson LC, Hsi LC, Eling TE. Troglitazone, a peroxisome proliferator-activated receptor gamma (PPAR gamma) ligand, selectively induces the early growth response-1 gene independently of PPAR gamma. A novel mechanism for its anti-tumorigenic activity. J Biol Chem. 2003;278:5845–5853. - PubMed
    1. Bolden JE, Peart MJ, Johnstone RW. Anticancer activities of histone deacetylase inhibitors. Nat Rev Drug Discov. 2006;5:769–784. - PubMed
    1. Bouillet P, Zhang LC, Huang DC, Webb GC, Bottema CD, Shore P, et al. Gene structure alternative splicing, and chromosomal localization of pro-apoptotic Bcl-2 relative Bim. Mamm Genome. 2001;12:163–168. - PubMed
    1. Brader KR, Wolf JK, Hung MC, Yu D, Crispens MA, van Golen KL, et al. Adenovirus E1A expression enhances the sensitivity of an ovarian cancer cell line to multiple cytotoxic agents through an apoptotic mechanism. Clin Cancer Res. 1997;3:2017–2024. - PubMed
    1. Burgess A, Ruefli A, Beamish H, Warrener R, Saunders N, Johnstone R, et al. Histone deacetylase inhibitors specifically kill nonproliferating tumour cells. Oncogene. 2004;23:6693–6701. - PubMed

Publication types

MeSH terms