. 2010 Jul 29;67(2):294-307.
doi: 10.1016/j.neuron.2010.06.017.

Thalamic gating of corticostriatal signaling by cholinergic interneurons

Affiliations

Thalamic gating of corticostriatal signaling by cholinergic interneurons

Jun B Ding et al. Neuron. .

Abstract

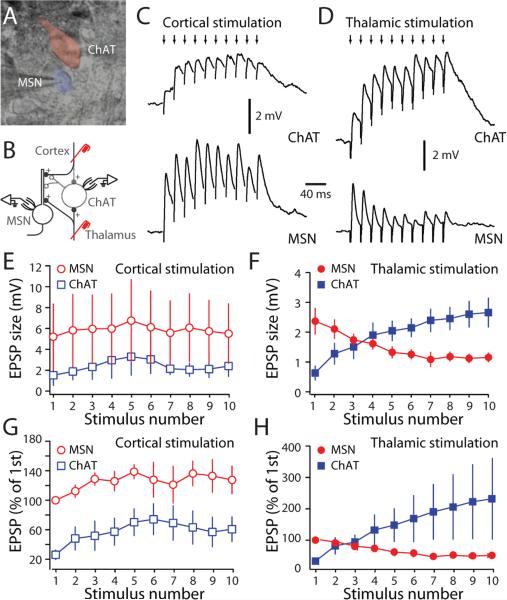
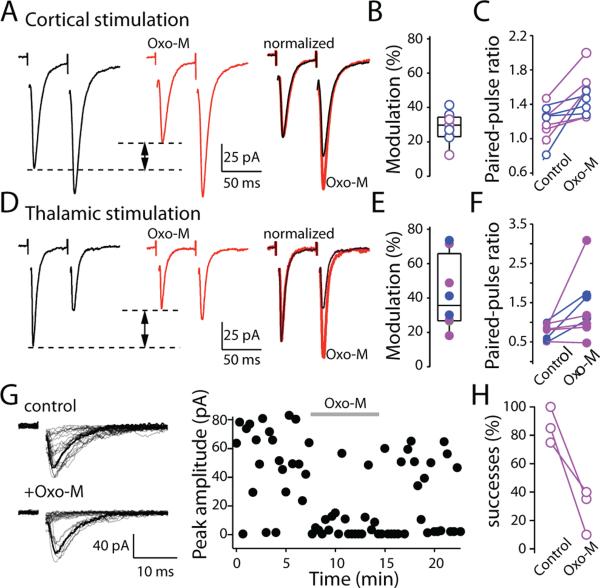
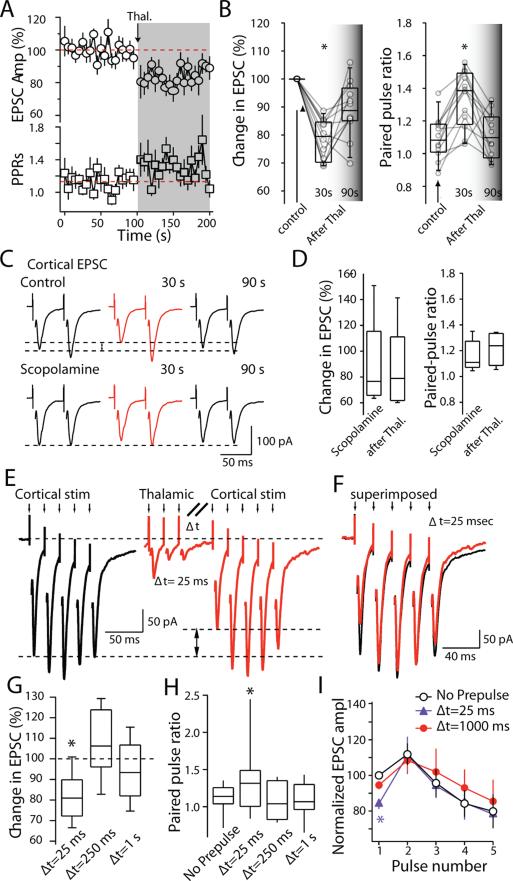
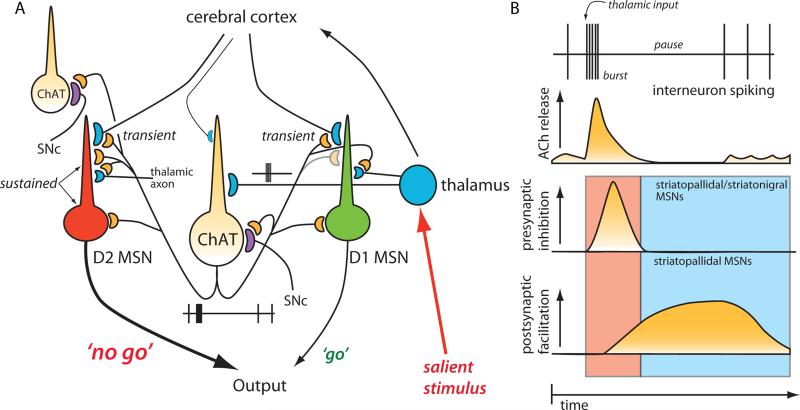
Salient stimuli redirect attention and suppress ongoing motor activity. This attentional shift is thought to rely upon thalamic signals to the striatum to shift cortically driven action selection, but the network mechanisms underlying this interaction are unclear. Using a brain slice preparation that preserved cortico- and thalamostriatal connectivity, it was found that activation of thalamostriatal axons in a way that mimicked the response to salient stimuli induced a burst of spikes in striatal cholinergic interneurons that was followed by a pause lasting more than half a second. This patterned interneuron activity triggered a transient, presynaptic suppression of cortical input to both major classes of principal medium spiny neuron (MSN) that gave way to a prolonged enhancement of postsynaptic responsiveness in striatopallidal MSNs controlling motor suppression. This differential regulation of the corticostriatal circuitry provides a neural substrate for attentional shifts and cessation of ongoing motor activity with the appearance of salient environmental stimuli.


Figures

Figure 1
Figure 1. Thalamic stimulation generated a ‘burst-pause’ firing pattern in cholinergic interneurons
(A) Composite diagram of a sagittal slice showing cortex (Ctx), striatum (CPu), lateral globus pallidus (LGP), internal capsule (i.c.). Shaded area indicates the region where EPSCs can be reliably evoked by cortical stimulation in the striatum. Insert: Experimental configuration. (B, C) Sample traces of cell-attached recordings of 10 consecutive responses from a cholinergic interneuron in response to a train (50 Hz, 10 pulses) of thalamic stimulation and cortical stimulation (Top). PSTHs and rasters of an autonomously firing cholinergic interneuron in response to thalamic and cortical stimulation (Bottom). A train of thalamic stimulation produced a ‘burst-pause’ firing pattern in the cholinergic interneuron. A train of cortical stimulation (arrow) produced a slight increase in firing rate. (D) Averaged population responses of cholinergic interneurons showing that trains of thalamic stimulation generate a ‘pause’ (left). In the same set of neurons, averaged population responses of cholinergic interneurons showing increased firing rate following cortical stimulation (right), but no pause. Rasters and histograms aligned to onset of stimulation train. (E) Example of an autocorrelogram of autonomous interneuron spiking, showing periodic activity. The autocorrelogram was aligned with PSTH to compare the mean duration of the pause and the mean ISI during autonomous spiking. (F) The action potential number generated during the stimulation train was plotted against the ratio of the first ISI after stimulation divided by the average ISI before stimulation. Thalamic stimulation (blue dots) produced more action potential during the stimulation and a longer pause compared to cortical stimulation (red circles). (G) In the same set of neurons, the average number of action potential evoked was plotted against the ratio of the first ISI after stimulation divided by the average ISI before stimulation. Thalamic 50 Hz stimulation generated 3-4 action potentials on average (3.73±1.07 action potential counts) The ratio between the first ISI and the average ISI was greater than one (First ISI/Ave ISI =2.85±1.27). In contrast, cortical stimulation produced less than 2 action potentials during the stimulation (1.42±0.56 action potential counts; P<0.05 compared to thalamic stimulation; Mann-Whitney) and the ratio of first ISI and the average ISI of the same neuron was one (First ISI/Ave ISI =1.04±0.32, P<0.05 compared to thalamic stimulation; Mann-Whitney). Experiments were performed at 32-35°C.
Figure 2
Figure 2. The thalamically stimulation evoked a dopamine-dependent pause
(A) PSTHs and rasters from a cholinergic interneuron in response to a train (50 Hz, 10 pulses) of thalamic stimulation in the absence and presence of the D2 receptor antagonist sulpiride (10 μM). (B) PSTHs and rasters from a cholinergic interneuron in response to a train (50 Hz, 10 pulses) of thalamic stimulation in the absence and presence of dopamine transporter blocker, cocaine (5 μM). (C) The number of action potential evoked in a trial was plotted against the ratio of the first ISI after stimulation divided by the average ISI before stimulation. Blockade of D2 receptor by sulpiride (red dots) significantly shorten the pause without affecting the mean firing frequency (control = 2.4±0.1; sulpiride=1.2±0.1, P<0.05, Mann-Whitney). (D) The number of action potentials evoked was plotted against the ratio of the first ISI after stimulation divided by the average ISI before stimulation. Application of DA transporter blocker, cocaine (5 μM, green dots), significantly prolonged the pause without affecting the mean firing frequency (Mean firing frequency, control = 3.52±0.38; cocaine=3.48±0.12, P>0.05, Mann-Whitney; First ISI/Ave ISI control = 1.9±0.1; cocaine=2.7±0.1, P<0.001, Mann-Whitney). (E) The number of action potentials evoked was plotted against the ratio of the first ISI after stimulation divided by the average ISI before stimulation. Blockade of nAChR receptor by mecamylamine (yellow dots) also significantly shortened the pause (mean firing frequency, control = 2.32±0.11; mecamylamine=2.35±0.08, P>0.05, Mann-Whitney; First ISI/Ave ISI control = 1.9±0.1; mecamylamine=1.5±0.1, P<0.001, Mann-Whitney). (F) Summary of the effects of sulpiride, cocaine and mecamylamine in the thalamically evoked pause; for each spike count (2-5) the difference between the drug treatment median First ISI/Ave ISI value and the control value was calculated; this difference was then averaged across spike counts. If there was no change in this ratio, the average should be zero; if the first ISI is shortened by drug treatment, the average should be negative; if the first ISI is lengthened by drug treatment, the average should be positive. Experiments were performed at 32-35°C.
Figure 3
Figure 3. Thalamic stimulation elicited distinctive postsynaptic responses in interneurons and MSNs
(A) Infrared differential interference contrast image showing an MSN and a cholinergic interneuron. (B) Schematic of the experimental configurations. (C) Paired recording from a cholinergic interneuron (ChAT) and a neighboring MSN during cortical stimulation. Cortical stimulation (small arrows, 50 Hz) evoked EPSPs in both cell types. However, EPSPs recorded in MSNs had a bigger amplitude. (D) Paired recording from ChAT) and neighboring MSN in response to train of thalamic stimulation. Thalamic stimulation (small arrows, 50 Hz) evoked EPSPs that summed differently in cholinergic interneurons and MSNs. (E) The evoked cortical EPSPs amplitudes in MSNs and cholinergic interneurons were plotted against stimulus number. (F) The evoked thalamic EPSPs amplitude in MSNs and cholinergic interneurons were plotted against stimulus number. (G) Normalized cortical EPSPs amplitude was plotted against stimulus number. Cortical EPSPs in cholinergic interneurons are smaller than those in MSNs. (H) Normalized thalamic EPSPs amplitude was plotted against stimulus number. Thalamic EPSPs in cholinergic interneurons summed differently than those in MSNs. To unmask EPSPs, hyperpolarizing current was injected into cholinergic interneuron to prevent cells from firing action potentials. Experiments were performed at 32-35°C.
Figure 4
Figure 4. Muscarinic receptor activation produced a presynaptic modulation of corticostriatal synapses in MSNs
(A) Sample EPSCs evoked by a paired-pulse cortical stimulation with 50 ms interstimulus interval. Application of muscarinic receptor agonist, oxotremorine-M (Oxo-M) decreased first EPSC amplitude and increased paired-pulse ratios (PPRs). (B) Box-plot summary of reduction in first EPSC amplitude. (C) Box-plot summary of changes in PPRs. (D) Sample EPSCs evoked by paired-pulse stimulation delivered to thalamus with 50 ms interstimulus interval. Oxo-M also decreased first EPSC amplitude and increased PPRs (right panels) (E) Box-plot summary of reduction in first EPSC amplitude. (F) Box-plot summary of changes in PPRs. (G) Sample EPSCs evoked by thalamic stimulation. Stimulation threshold was reduced to allow transmission failures. (H) Oxo-M significantly decreased success rate. In all plots, data collected from D2 MSNs were shown as magenta dots, data from D1 MSNs were shown as blue dots. Experiments were performed at room temperature.
Figure 5
Figure 5. Corticostriatal synaptic transmission was depressed by thalamic stimulation
(A) Time course of changes in cortical EPSC amplitude and PPRs in response to thalamic burst stimulation. Consistent with a presynaptic mechanism, there was a clear increase in PPRs accompanied by reduction in ESPC amplitude. (B) Box-plot summary of the change in first EPSC amplitude (left) and change in PPRs (right). (C) Sample EPSCs evoked by a paired-pulse cortical stimulation with 50 ms interstimulus interval. Traces illustrate the suppression of EPSC amplitude and increase in PPRs at cortical afferent synapses after burst stimulation of thalamic afferents. Scopolamine blocked the depression. (D) Box-plot summary of change in first EPSC amplitude (left) and changes in PPRs (right) in the presence of scopolamine. (E) Sample traces of cortical EPSCs recorded from a medium spiny neuron in the absence (left) and presence (right) of a thalamic pre-pulse with 25 ms interval (Δt=25 ms) at physiological temperature. (F) Cortical EPSCs were superimposed to illustrate the changes in EPSCs amplitudes (Δt=25 ms). (G) Box-plot summary of the reduction in first EPSC amplitude. Presynaptic modulation of cortical EPSCs by thalamic burst stimulation recovered quickly at higher temperature (Median amplitude=82% of control; P<0.05; median amplitude=108% of control at 250 ms, P>0.05, n=10;median amplitude=94% of control at 1s , P>0.05, ANOVA; n=10). (H) Box-plot summary of the paired pulse ratio (Mean control PPR=1.11; PPR(25ms)=1.30, P<0.05; PPR(250ms)=1.09, P>0.05, ;PPR(1s)=1.09, P>0.05, ANOVA; n=10). (I) Pooled data (n = 10) showing the effect of the thalamic pre-pulse on short term plasticity of EPSCs evoked by 50 Hz cortical afferent stimulation. Experiments illustrated in A-D were performed at room temperature; E-I were performed at 32-35°C.
Figure 6
Figure 6. Thalamic stimulation produced a biphasic modulation of corticostriatal EPSPs
(A) Corticostriatal EPSPs recorded from a D2 MSN (inset: Experimental configuration). (B) When a thalamic stimulus train was given 25 ms before the cortical EPSPs, cortical EPSPs were depressed. (C) Cortical EPSPs before and after conditioning were superimposed to illustrate the changes in first EPSP amplitude and EPSP summation (Δt=25 ms). (D) Pooled data (n = 9) showing the effect of thalamic pre-pulse on EPSPs summation evoked by 50 Hz cortical afferent stimulation (Δt=25 ms). (E) The reduction in first EPSP amplitude was blocked by the muscarinic receptor antagonist, scopolamine. (F) When the interval between thalamic pre-pulse and cortical stimulation was prolonged to 1 s, the thalamic pre-pulse had no significant effect on first EPSP amplitude, whereas the amplitude of the 5th EPSP was significantly increased (Δt=1 s). (G) Pooled data (n = 9) showing that 1 s after thalamic pre-pulse EPSPs summation evoked by 50 Hz cortical afferent stimulation was significantly increased. (H) There was no reduction in first EPSP amplitude (Δt=1 s). Scopolamine did not significantly change the first EPSP amplitude. Experiments were performed at 32-35°C.
Figure 7
Figure 7. Summation of corticostriatal EPSPs was increased by slowing their decay rate
(A) EPSPs were fitted with five double-exponential functions (thick line). (B) Each individual fit EPSP was generated and plotted based on fitted values. (C, D) The first and fifth fitted EPSP were superimposed (C) and normalized (D) to compare amplitude and kinetics of each individual EPSP. (E) Box-plot summary of fit EPSP rise time constant. There are no significant changes in rise time constant when thalamic pre-pulse was introduced. (F) Box-plot summary of fit EPSP decay time constant. Cortical EPSP decay time constant significantly increased when the thalamic pre-pulse was given one second before cortical stimulation, but not immediate before cortical stimulation. (G) Summary graph of normalized fit EPSP amplitude plot against stimulation pulse number. Reduction in the first EPSP amplitude was only seen inΔt=25 ms (median= 80% of control, P<0.05;Wilcoxon; n=9). The amplitudes of the fit EPSPs at the longer delay (Δt=1 s) were not different from those of the control (P>0.05;Wilcoxon; n=9; in all panels: blue,Δt=25 ms; red,Δt=1 s). Experiments were performed at 32-35°C.
Figure 8
Figure 8. Presynaptic and postsynaptic modulation was dependent on muscarinic receptor activation
(A) Left: Box-plot summary of changes in first EPSP amplitude recorded from D1 MSNs with thalamic pre-pulse (Δt=25 ms; median 82% of control; P<0.05; Wilcoxon; n=8;Δt=1 s; 93.4 of control; P>0.05; Wilcoxon; n=8). Right: Pooled data showing the effect of thalamic pre-pulse on EPSPs summation in D1 MSNs evoked by 50 Hz cortical stimulation. The normalized fifth EPSP was 78 ±9% in control;Δt=25 ms; 69±8%; P>0.05; Wilcoxon; n=8;Δt=1 s, 79±8 %; P>0.05; Wilcoxon; n=8. (B) Left: Box-plot summary of changes in first EPSP amplitude in D2R neurons with thalamic pre-pulse in the presence of scopolamine (Δt=25 ms; median 104.9% of control; P>0.05; Wilcoxon; n=7;Δt=1 s, 92.1% of control; P>0.05; Wilcoxon; n=7). Right: Pooled data showing the effect of thalamic pre-pulse on EPSPs summation in D2 MSNs evoked by 50 Hz cortical stimulation in the presence of scopolamine. The normalized fifth EPSP was 137±14% in control;Δt=25 ms; 145±23%; P>0.05; Wilcoxon; n=7;Δt=1 s, 143±31%;P>0.05; Wilcoxon; n=7). (C) Left: Box-plot summary of changes in first EPSP amplitude in D2 MSNs with thalamic pre-pulse in M1 muscarinic receptor knockout mice (Δt=25 ms; 88% of control; P<0.05; Wilcoxon; n=7;Δt=1 s, 108% of control; P>0.05; Wilcoxon; n=7). Right: Pooled data showing the effect of thalamic pre-pulse on EPSPs summation in M1 knockout D2 MSNs. (The normalized fifth EPSP was 94±9% in M1 knockout control;Δt=25 ms; 101±9%; P>0.05; Wilcoxon; n=7;Δt=1 s, 92±10%; P>0.05; Wilcoxon; n=7). Experiments were performed at 32-35°C.
Figure 9
Figure 9. Schematic summary of thalamic gating of glutamatergic signaling in the striatum
(A). Schematic illustration of cortico- and thalamostriatal glutamatergic projections. Both D1 and D2 MSNs receive glutamatergic afferents from the cortex and the thalamus. However, cholinergic interneuron receives glutamatergic inputs primarily from the thalamus. (B). Thalamic inputs efficiently drive cholinergic interneuron and generate a burst-pause firing pattern. By acting at presynaptic M2-class receptors, acetylcholine release transiently suppresses release probability at corticostriatal synapses formed on both D1 and D2 MSNs. By acting at postsynaptic M1 receptors, acetylcholine release primarily enhances the responsiveness of D2 MSNs to corticostriatal input for about a second. The pause in cholinergic interneuron activity ensures that there is not a concomitant presynaptic suppression in this window. Thalamic stimulation should activate neighboring cholinergic interneurons as well. The pause is generated in part by recurrent collateral or neighboring interneuron activation of nicotinic receptors on dopaminergic terminals. In this way, the burst of thalamic spikes engages cholinergic interneurons to transiently suppress cortical drive of striatal circuits and then create a second long period in which the striatal network is strongly biased toward cortical activation of D2 MSNs.

Comment in

Similar articles

Cited by

References

    1. Akins PT, Surmeier DJ, Kitai ST. M1 muscarinic acetylcholine receptor in cultured rat neostriatum regulates phosphoinositide hydrolysis. J Neurochem. 1990;54:266–273. - PubMed
    1. Alcantara AA, Mrzljak L, Jakab RL, Levey AI, Hersch SM, Goldman-Rakic PS. Muscarinic m1 and m2 receptor proteins in local circuit and projection neurons of the primate striatum: anatomical evidence for cholinergic modulation of glutamatergic prefronto-striatal pathways. J Comp Neurol. 2001;434:445–460. - PubMed
    1. Aosaki T, Graybiel AM, Kimura M. Effect of the nigrostriatal dopamine system on acquired neural responses in the striatum of behaving monkeys. Science. 1994;265:412–415. - PubMed
    1. Barral J, Galarraga E, Bargas J. Muscarinic presynaptic inhibition of neostriatal glutamatergic afferents is mediated by Q-type Ca2+ channels. Brain Res Bull. 1999;49:285–289. - PubMed
    1. Bennett BD, Callaway JC, Wilson CJ. Intrinsic membrane properties underlying spontaneous tonic firing in neostriatal cholinergic interneurons. J Neurosci. 2000;20:8493–8503. - PMC - PubMed

Publication types

MeSH terms