. 2010 Aug;12(8):799-805.
doi: 10.1038/ncb2085. Epub 2010 Jul 25.

Asymmetrically inherited multidrug resistance transporters are recessive determinants in cellular replicative ageing

Affiliations

Asymmetrically inherited multidrug resistance transporters are recessive determinants in cellular replicative ageing

Amr Eldakak et al. Nat Cell Biol. 2010 Aug.

Abstract

Cellular ageing is known to correlate with the accumulation of many harmful agents, but it is unclear whether ageing can also result from the deterioration of components that are beneficial to the cell, but have a low rate of renewal. Here, we report a group of plasma membrane-associated transporters in yeast, belonging to the multidrug resistance (MDR) protein families, that may represent the latter type of ageing determinants. During the division of a yeast cell, newly synthesized transporter proteins are deposited mostly into the growing bud, whereas previously synthesized MDR proteins remain tightly associated with the mother cortex. Thus, the new and old pools of membrane-bound MDR proteins are spatially segregated during yeast asymmetric cell division, with the older pool stably inherited by the ageing mother. A model based on the observed dynamics of MDR protein inheritance and turnover predicted a decline in MDR activity as the mother cell advances in replicative age. As MDR proteins have crucial roles in cellular metabolism, detoxification and stress response, their collective decline may lead to fitness loss at an advanced age. Supporting this hypothesis, mutants lacking certain MDR genes exhibited a reduced replicative lifespan (RLS), whereas introduction of only one extra copy of these MDR genes extended RLS.


Conflict of interest statement

COMPETING FINANCIAL INTERESTS The authors declare no competing financial interests.

Figures

Figure 1
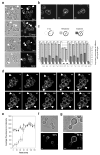
Figure 1. A group of MDR transporter proteins are asymmetrically localized in the mother cortex in a cell cycle-regulated manner
a, Representative images of different GFP-tagged transporters showing asymmetric localization to the mother cortex in small budded cells and loss of this asymmetry in large budded cells. White arrows point to small buds with no Tpo1-GFP; arrowheads point to large-budded cells with Tpo1-GFP in the bud. b, Representative images of cells expressing Tpo1-GFP and GFP-Tub1 (as a marker for the spindle length and hence cell cycle stage) showing asymmetric Tpo1-GFP localization in cells in S-G2 and M phases and a loss of the asymmetry in anaphase cells. c, Quantification of cells displaying asymmetric transporter localization toward the mother (n > 200 cells) in populations with specific spindle morphologies, as represented by the color scheme in the cartoon drawings. d, Montage of fluorescence images of cells expressing Tpo1-GFP and GFP-Tub1 (Supplementary Information, Movie S1) showing Tpo1 localization changes during the cell cycle. White arrows follow small buds that started with asymmetric Tpo1 localization through different cell cycle stages. e, Average fluorescence intensities of Tpo1-GFP on the cortex of the mother (squares) and bud (circles) cells over time as recorded in Supplementary Information, Movie S1. Bars show the standard error of the mean (SEM) from 3 different cells quantified. f-g, Asymmetric Tpo1-GFP distribution in cells arrested in metaphase either by using nocodazole (f, average cortex fluorescence intensity Ibud/ Imother = 0.2, n=17) or by the temperature sensitive allele cdc23-1 at 37 °C (g, Ib/Im = 0.17, n = 22). Scale bars: 2 μm.
Figure 2
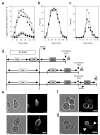
Figure 2. The timing of Tpo1 expression during the cell cycle is critical to the observed localization patterns
a, Total RNA at different time points was purified from cells released from G1-arrest. Using cDNA generated from total RNA, quantitative PCR (qPCR) confirmed that TPO1 (circles) expression peaks at M-phase upon comparison to SWI5 (squares) expression profile. Three biological replicates are shown. b-c, Cell cycle progression was tracked by the budding index (b) and nuclear division kinetics (c) for the three biological replicates used for RNA purification in quantitative RT-PCR analyses. d, Schematic diagrams explaining the experiment of pulse-expressing Tpo1-GFP with the GAL1 promoter at different cell cycle stages in cell cultures synchronized in G1 with the α mating factor. Top row: pulse expression in G1; middle row: pulse expression in S/M; and bottom row: pulse expression in S/M followed by release from the nocodazole block. e, Pulse expression of Tpo1-GFP in G1 (top panels) resulted in asymmetric localization toward the mother after bud formation (bottom panels). M: mother; D: daughter. The mother can be distinguished from the bud (daughter) due to the shmoo shape caused by pheromone arrest. f-g, Pulse expression of Tpo1-GFP in S/M resulted in asymmetric localization toward the bud (f), and upon further release of the budded cells from the nocodazole block, the bud (D2) of the first daughter cell (D1) was completely devoid of Tpo1-GFP (g). Percent numbers refer to % of cells with the characteristic Tpo1 localization pattern noted in the text for each panel. Scale bars: 2 μm.
Figure 3
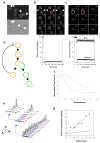
Figure 3. Stable inheritance and protein abundance and activity changes of Tpo1 during RLS
a, Septin mutant cdc12-6 grown at 37 °C for 1 hr to disrupt the septin ring maintained asymmetric localization of Tpo1p to the mother cortex. Note cells developed the elongated buds (arrowheads) typical of septin deficient cells. Scale bars: 2 μm. b-c, FRAP analysis of Tpo1-GFP demonstrating a lack of diffusion in the membrane (b) or exchange between the mother and the bud (c). In b, a small section of the mother cortex (red circle) of two cells with small buds (arrows) was photobleached. Montage of the movie (top) and quantification of fluorescence recovery as a percentage of the pre-bleached level (bottom) are shown. In c, the entire cortex of the mother cell (red circle) was photobleached and montage of the movie (top) and quantification (bottom) as in (b) are shown. The bud fluorescence was also plotted showing no loss after bleaching of the mother. Error bars represent SEM (n=9 for b; 5 for c). Scale bars: 2 μm. d, Schematic diagram showing asymmetric inheritance of different pools of MDR protein during each cell division. Orange represents the original pool of MDR proteins in the mother. At anaphase, a new pool of MDR proteins (green) is synthesized but is mostly deposited into the bud, the new cell to be. e, Examination of Tpo1-GFP stability by FACS. Shown are distributions of the population (cell %) along the fluorescence scale at different time points. Due to reduction in GFP+ population, the “cell %” scale was consecutively reduced (arrows) for the boxed areas to show peaks. At the start of the chase the entire population was GFP+, but as a result of asymmetric division and retention of Tpo1-GFP in the mother cells, all subsequent newborn cells are GFP- (low fluorescence). f, Simulation of Tpo1 level change (blue) and activity decay (red) over a cell’s RLS. See Supplementary Information for model details. g, Spermidine uptake, at pH 7.2, for equal-dry weight young (black circles) and old cell (gray squares) populations sorted by elutriation from the same culture (see Supplementary Information, Fig. S2d).
Figure 4
Figure 4. Levels of different MDR transporters affect the replicative life span
a, A representative set of viability curves from a single experiment showing deletions of different MDR transporters, tpo1Δ, ctr1Δ, or yor1Δ (in a-mating type strains), reduced RLS relative to the wild-type a strain (BY4741) (for α strain analysis see Supplementary Information, Fig. S3b-d and Supplementary Information, Table 2 online). b, An extra copy of TPO1 increases TPO1 expression, as shown by quantitative PCR (left bar graph) and Tpo1-GFP cortical fluorescence intensity (right bar graph). Representative images are shown for Tpo1-GFP in cells with 1x TPO1-GFP (specifically marked with the spindle pole body marker Spc42-mCherry) or 2x TPO1-GFP observed in the same field. Error bars represent SEM (n>100). Scale bar: 2 μm. c-e, Representative viability curves showing that introduction of an extra copy of TPO1, CTR1 or YOR1 extended RLS relative to the wild type (BY4741) tested along side of each mutant strain in the same experiment. f, Bar graphs representing the effect of deletion or 1 extra copy of TPO1, CTR1 or YOR1 on RLS, as represented by the percentage difference of mean RLS relative to that of their corresponding wild-type control strain. See Supplementary Information, Table 2 online for all details of the result.

Similar articles

Cited by

References

    1. Henderson KA, Gottschling DE. A mother’s sacrifice: what is she keeping for herself? Current Opinion in Cell Biology. 2008;20:723–728. - PMC - PubMed
    1. Steinkraus KA, Kaeberlein M, Kennedy B. Replicative Aging in Yeast: The Means to the End. Annual Review of Cell and Developmental Biology. 2008;24 - PMC - PubMed
    1. Mortimer RK, Johnston JR. Life Span of Individual Yeast cells. Nature. 1959;183:1751–1752. - PubMed
    1. Erjavec N, Larsson L, Grantham J, Nystrom T. Accelerated aging and failure to segregate damaged proteins in Sir2 mutants can be suppressed by overproducing the protein aggregation-remodeling factor Hsp104p. Genes & Development. 2007;21:2410–2421. - PMC - PubMed
    1. Sinclair DA, Guarente L. Extrachromosomal rDNA Circles A Cause of Aging in Yeast. 1997;91:1033–1042. - PubMed

Publication types

MeSH terms

Substances