

Interleukin-8 is associated with proliferation, migration, angiogenesis and chemosensitivity in vitro and in vivo in colon cancer cell line models
- PMID: 20648559
- PMCID: PMC3039715
- DOI: 10.1002/ijc.25562
Interleukin-8 is associated with proliferation, migration, angiogenesis and chemosensitivity in vitro and in vivo in colon cancer cell line models
Abstract
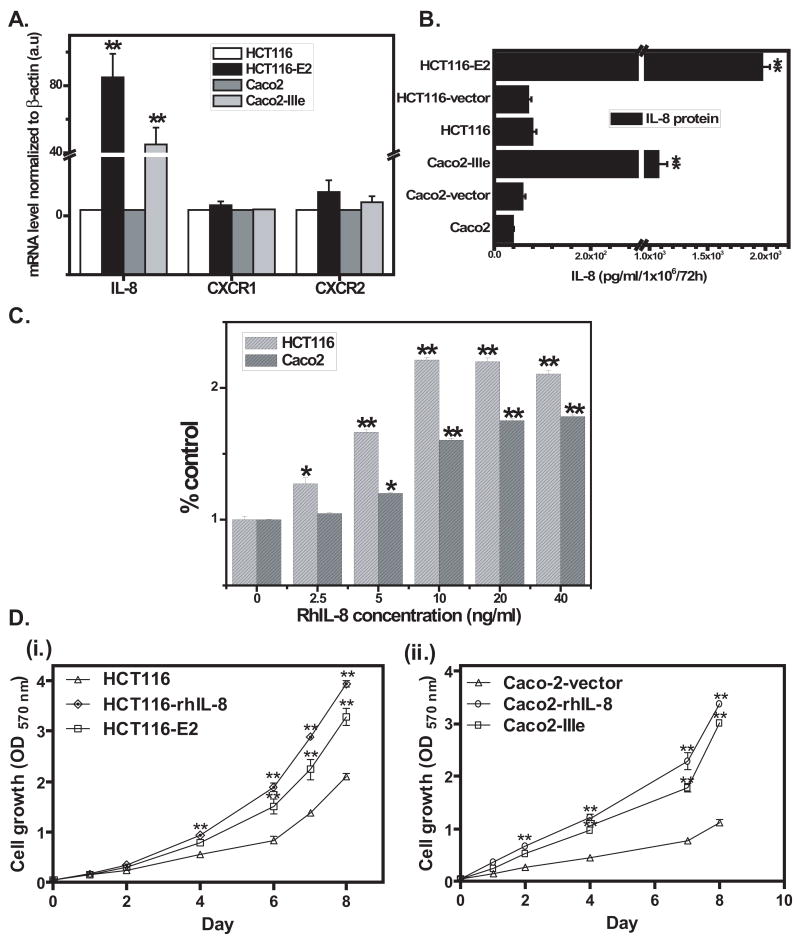
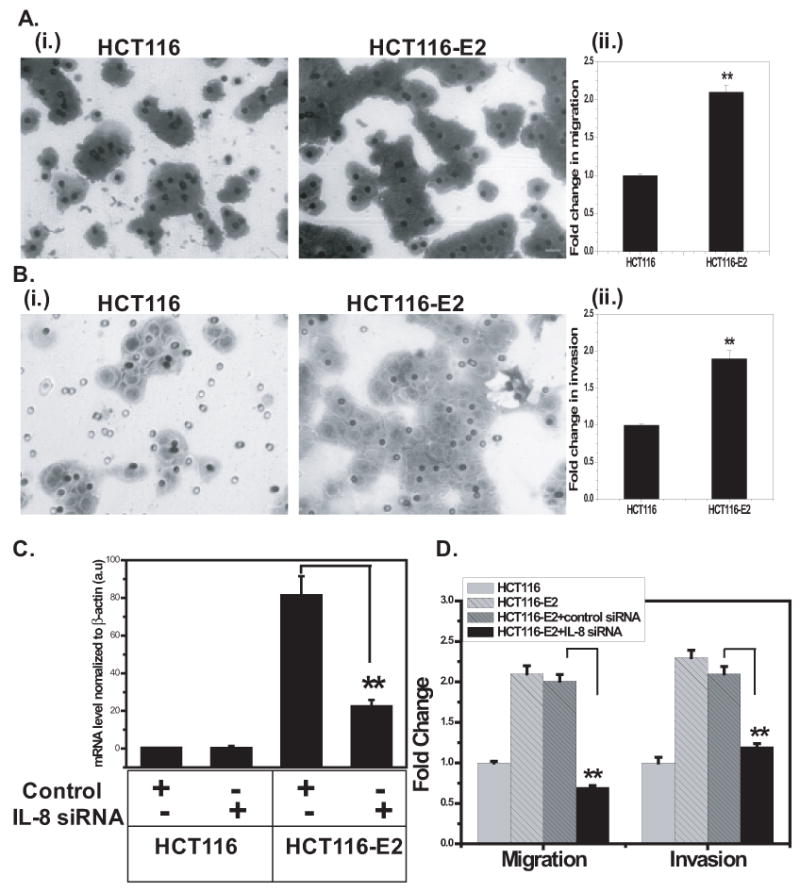
Interleukin-8 (IL-8), a chemokine with a defining CXC amino acid motif, is known to possess tumorigenic and proangiogenic properties. Overexpression of IL-8 has been detected in many human tumors, including colorectal cancer (CRC), and is associated with poor prognosis. The goal of our study was to determine the role of IL-8 overexpression in CRC cells in vitro and in vivo. We stably transfected the IL-8 cDNA into two human colon cancer cell lines, HCT116 and Caco2, and selected IL-8-secreting transfectants. Real-time RT-PCR confirmed that IL-8 mRNA was overexpressed in IL-8 transfectants with 45- to 85-fold higher than parental cells. The IL-8-transfected clones secreted 19- to 28-fold more IL-8 protein than control and parental cells as detected by ELISA. The IL-8 transfectants demonstrated increased cellular proliferation, cell migration and invasion based on functional assays. Growth inhibition studies showed that IL-8 overexpression lead to a significant resistance to oxaliplatin (p < 0.0001). Inhibition of IL-8 overexpression with small interfering RNA reversed the observed increases in tumorigenic functions and oxaliplatin resistance, suggesting that IL-8 not only provides a proliferative advantage but also promotes the metastatic potential of colon cancer cells. Using a tumor xenograft model, IL-8-expressing cells formed significantly larger tumors than the control cells with increased microvessel density. Together, these findings indicate that overexpression of IL-8 promotes tumor growth, metastasis, chemoresistance and angiogenesis, implying IL-8 to be an important therapeutic target in CRC.
Copyright © 2010 UICC.
Figures


Similar articles
-
Interleukin-8 associates with adhesion, migration, invasion and chemosensitivity of human gastric cancer cells.World J Gastroenterol. 2012 Mar 7;18(9):979-85. doi: 10.3748/wjg.v18.i9.979. World J Gastroenterol. 2012. PMID: 22408359 Free PMC article.
-
Interleukin-1 Receptor Type 2 Acts with c-Fos to Enhance the Expression of Interleukin-6 and Vascular Endothelial Growth Factor A in Colon Cancer Cells and Induce Angiogenesis.J Biol Chem. 2015 Sep 4;290(36):22212-24. doi: 10.1074/jbc.M115.644823. Epub 2015 Jul 24. J Biol Chem. 2015. PMID: 26209639 Free PMC article.
-
The CXCR2 antagonist, SCH-527123, shows antitumor activity and sensitizes cells to oxaliplatin in preclinical colon cancer models.Mol Cancer Ther. 2012 Jun;11(6):1353-64. doi: 10.1158/1535-7163.MCT-11-0915. Epub 2012 Mar 5. Mol Cancer Ther. 2012. PMID: 22391039
-
IL-1alpha secreted by colon cancer cells enhances angiogenesis: the relationship between IL-1alpha release and tumor cells' potential for liver metastasis.J Surg Oncol. 2009 May 1;99(6):361-7. doi: 10.1002/jso.21245. J Surg Oncol. 2009. PMID: 19204921
-
Endothelial cells-directed angiogenesis in colorectal cancer: Interleukin as the mediator and pharmacological target.Int Immunopharmacol. 2023 Jan;114:109525. doi: 10.1016/j.intimp.2022.109525. Epub 2022 Dec 9. Int Immunopharmacol. 2023. PMID: 36508917 Review.
Cited by
-
Serum cytokine profile as a potential prognostic tool in colorectal cancer patients - one center study.Rep Pract Oncol Radiother. 2020 Nov-Dec;25(6):867-875. doi: 10.1016/j.rpor.2020.08.004. Epub 2020 Aug 21. Rep Pract Oncol Radiother. 2020. PMID: 32982592 Free PMC article.
-
Biofabrication of 3D breast cancer models for dissecting the cytotoxic response of human T cells expressing engineered MAIT cell receptors.Biofabrication. 2022 Sep 29;14(4):10.1088/1758-5090/ac925a. doi: 10.1088/1758-5090/ac925a. Biofabrication. 2022. PMID: 36108605 Free PMC article.
-
Cytokine-Induced Modulation of Colorectal Cancer.Front Oncol. 2016 Apr 19;6:96. doi: 10.3389/fonc.2016.00096. eCollection 2016. Front Oncol. 2016. PMID: 27148488 Free PMC article. Review.
-
Pro-inflammatory cytokines in cryptoglandular anal fistulas.Tech Coloproctol. 2016 Sep;20(9):619-25. doi: 10.1007/s10151-016-1494-7. Epub 2016 Jul 11. Tech Coloproctol. 2016. PMID: 27402195 Free PMC article.
-
Research progress in molecular pathology markers in medulloblastoma.Explor Target Antitumor Ther. 2023;4(1):139-156. doi: 10.37349/etat.2023.00126. Epub 2023 Feb 28. Explor Target Antitumor Ther. 2023. PMID: 36937322 Free PMC article. Review.
References
-
- Jemal A, Siegel R, Ward E, Hao Y, Xu J, Thun MJ. Cancer Statistics, 2009. CA Cancer J Clin. 2009 - PubMed
-
- Balkwill F. Cancer and the chemokine network. Nat Rev Cancer. 2004;4:540–50. - PubMed
-
- Araki S, Omori Y, Lyn D, Singh RK, Meinbach DM, Sandman Y, Lokeshwar VB, Lokeshwar BL. Interleukin-8 is a molecular determinant of androgen independence and progression in prostate cancer. Cancer Res. 2007;67:6854–62. - PubMed
-
- Waugh DJ, Wilson C. The interleukin-8 pathway in cancer. Clin Cancer Res. 2008;14:6735–41. - PubMed
-
- Harada A, Sekido N, Akahoshi T, Wada T, Mukaida N, Matsushima K. Essential involvement of interleukin-8 (IL-8) in acute inflammation. J Leukoc Biol. 1994;56:559–64. - PubMed
Publication types
MeSH terms
Substances
Grants and funding
LinkOut - more resources
Full Text Sources
Other Literature Sources
