Gene expression profiles of Beta-cell enriched tissue obtained by laser capture microdissection from subjects with type 2 diabetes
- PMID: 20644627
- PMCID: PMC2903480
- DOI: 10.1371/journal.pone.0011499
Gene expression profiles of Beta-cell enriched tissue obtained by laser capture microdissection from subjects with type 2 diabetes
Abstract
Background: Changes in gene expression in pancreatic beta-cells from type 2 diabetes (T2D) should provide insights into their abnormal insulin secretion and turnover.
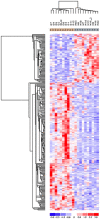
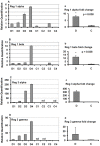
Methodology/principal findings: Frozen sections were obtained from cadaver pancreases of 10 control and 10 T2D human subjects. Beta-cell enriched samples were obtained by laser capture microdissection (LCM). RNA was extracted, amplified and subjected to microarray analysis. Further analysis was performed with DNA-Chip Analyzer (dChip) and Gene Set Enrichment Analysis (GSEA) software. There were changes in expression of genes linked to glucotoxicity. Evidence of oxidative stress was provided by upregulation of several metallothionein genes. There were few changes in the major genes associated with cell cycle, apoptosis or endoplasmic reticulum stress. There was differential expression of genes associated with pancreatic regeneration, most notably upregulation of members of the regenerating islet gene (REG) family and metalloproteinase 7 (MMP7). Some of the genes found in GWAS studies to be related to T2D were also found to be differentially expressed. IGF2BP2, TSPAN8, and HNF1B (TCF2) were upregulated while JAZF1 and SLC30A8 were downregulated.
Conclusions/significance: This study made possible by LCM has identified many novel changes in gene expression that enhance understanding of the pathogenesis of T2D.
Conflict of interest statement
Figures


Similar articles
-
Gene expression of purified beta-cell tissue obtained from human pancreas with laser capture microdissection.J Clin Endocrinol Metab. 2008 Mar;93(3):1046-53. doi: 10.1210/jc.2007-0931. Epub 2007 Dec 11. J Clin Endocrinol Metab. 2008. PMID: 18073315 Free PMC article.
-
The endoplasmic reticulum in pancreatic beta cells of type 2 diabetes patients.Diabetologia. 2007 Dec;50(12):2486-94. doi: 10.1007/s00125-007-0816-8. Epub 2007 Sep 30. Diabetologia. 2007. PMID: 17906960
-
Towards better understanding of the contributions of overwork and glucotoxicity to the beta-cell inadequacy of type 2 diabetes.Diabetes Obes Metab. 2009 Nov;11 Suppl 4:82-90. doi: 10.1111/j.1463-1326.2009.01113.x. Diabetes Obes Metab. 2009. PMID: 19817791 Review.
-
Evidence of stress in β cells obtained with laser capture microdissection from pancreases of brain dead donors.Islets. 2017 Mar 4;9(2):19-29. doi: 10.1080/19382014.2017.1283083. Islets. 2017. PMID: 28252345 Free PMC article.
-
Oxidative and endoplasmic reticulum stress in β-cell dysfunction in diabetes.J Mol Endocrinol. 2016 Feb;56(2):R33-54. doi: 10.1530/JME-15-0232. Epub 2015 Nov 17. J Mol Endocrinol. 2016. PMID: 26576641 Review.
Cited by
-
Correlation analysis of epicardial adipose tissue thickness, C-reactive protein, interleukin-6, visfatin, juxtaposed with another zinc finger protein 1, and type 2 diabetic macroangiopathy.Lipids Health Dis. 2021 Mar 15;20(1):25. doi: 10.1186/s12944-021-01451-7. Lipids Health Dis. 2021. PMID: 33722242 Free PMC article.
-
Identification of potential markers for type 2 diabetes mellitus via bioinformatics analysis.Mol Med Rep. 2020 Sep;22(3):1868-1882. doi: 10.3892/mmr.2020.11281. Epub 2020 Jun 26. Mol Med Rep. 2020. PMID: 32705173 Free PMC article.
-
Diabetes genes identified by genome-wide association studies are regulated in mice by nutritional factors in metabolically relevant tissues and by glucose concentrations in islets.BMC Genet. 2013 Feb 25;14:10. doi: 10.1186/1471-2156-14-10. BMC Genet. 2013. PMID: 23442068 Free PMC article.
-
Islet β cell mass in diabetes and how it relates to function, birth, and death.Ann N Y Acad Sci. 2013 Apr;1281(1):92-105. doi: 10.1111/nyas.12031. Epub 2013 Jan 30. Ann N Y Acad Sci. 2013. PMID: 23363033 Free PMC article. Review.
-
Islet inflammation: a unifying target for diabetes treatment?Trends Endocrinol Metab. 2013 Jul;24(7):351-60. doi: 10.1016/j.tem.2013.01.007. Epub 2013 Feb 26. Trends Endocrinol Metab. 2013. PMID: 23484621 Free PMC article. Review.
References
-
- Weir GC, Bonner-Weir S. Five stages of evolving beta-cell dysfunction during progression to diabetes. Diabetes. 2004;53(Suppl 3):S16–21. - PubMed
-
- Brunzell JD, Robertson RP, Lerner RL, Hazzard WR, Ensinck JW, et al. Relationships between fasting plasma glucose levels and insulin secretion during intravenous glucose tolerance tests. J Clin Endocrinol Metab. 1976;42:222–229. - PubMed
-
- Ferrannini E, Gastaldelli A, Miyazaki Y, Matsuda M, Mari A, et al. beta-Cell function in subjects spanning the range from normal glucose tolerance to overt diabetes: a new analysis. J Clin Endocrinol Metab. 2005;90:493–500. - PubMed
-
- Butler AE, Janson J, Bonner-Weir S, Ritzel R, Rizza RA, et al. Beta-cell deficit and increased beta-cell apoptosis in humans with type 2 diabetes. Diabetes. 2003;52:102–110. - PubMed
-
- Rahier J, Guiot Y, Goebbels RM, Sempoux C, Henquin JC. Pancreatic beta-cell mass in European subjects with type 2 diabetes. Diabetes Obes Metab. 2008;10(Suppl 4):32–42. - PubMed
Publication types
MeSH terms
Substances
Grants and funding
LinkOut - more resources
Full Text Sources
Medical
Molecular Biology Databases

