. 2010 Aug 30;207(9):1843-51.
doi: 10.1084/jem.20100451. Epub 2010 Jul 19.

Argonaute 2 in dopamine 2 receptor-expressing neurons regulates cocaine addiction

Affiliations

Argonaute 2 in dopamine 2 receptor-expressing neurons regulates cocaine addiction

Anne Schaefer et al. J Exp Med. .

Abstract

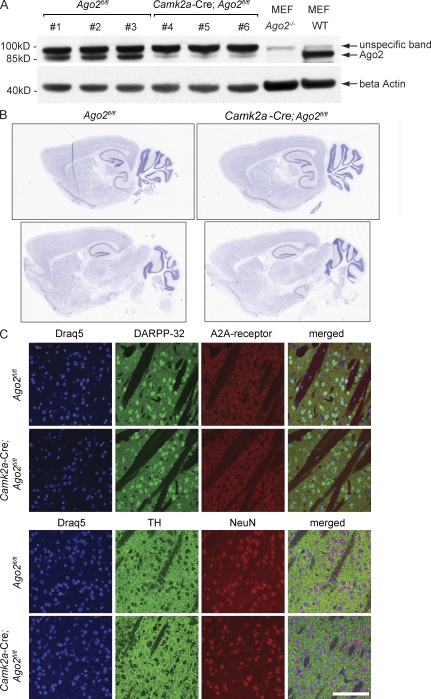
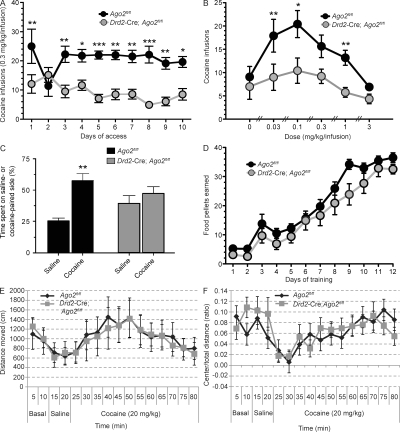
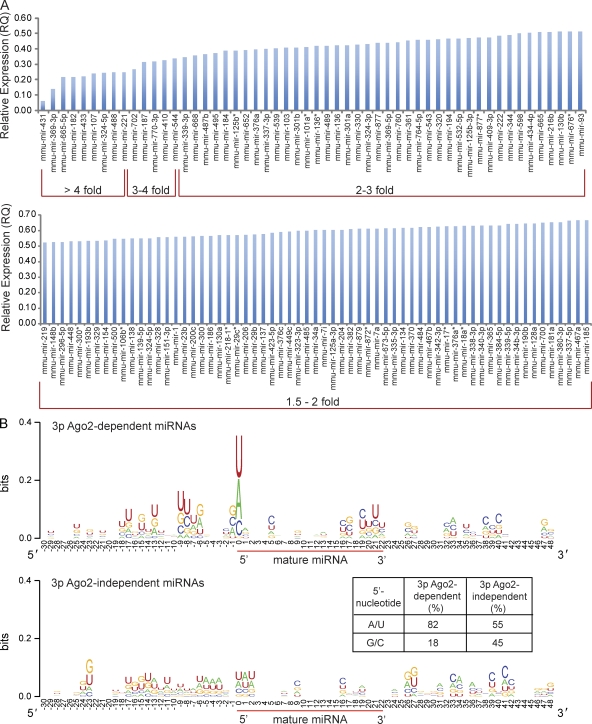
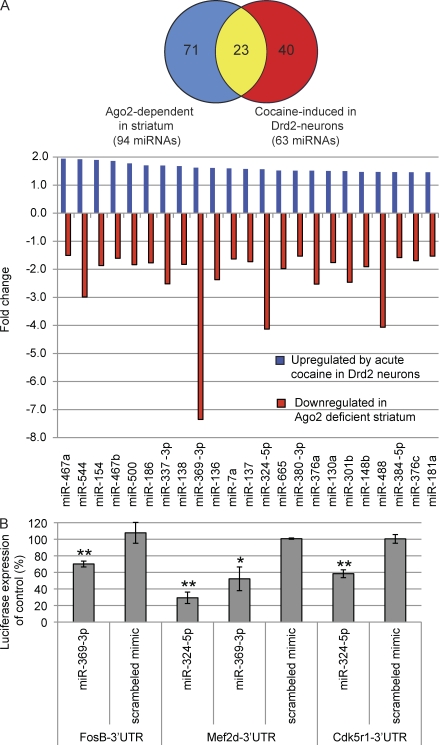
Cocaine is a highly addictive drug that exerts its effects by increasing the levels of released dopamine in the striatum, followed by stable changes in gene transcription, mRNA translation, and metabolism within medium spiny neurons in the striatum. The multiple changes in gene and protein expression associated with cocaine addiction suggest the existence of a mechanism that facilitates a coordinated cellular response to cocaine. Here, we provide evidence for a key role of miRNAs in cocaine addiction. We show that Argonaute 2 (Ago2), which plays an important role in miRNA generation and execution of miRNA-mediated gene silencing, is involved in regulation of cocaine addiction. Deficiency of Ago2 in dopamine 2 receptor (Drd2)-expressing neurons greatly reduces the motivation to self-administer cocaine in mice. We identified a distinct group of miRNAs that is specifically regulated by Ago2 in the striatum. Comparison of miRNAs affected by Ago2 deficiency with miRNAs that are enriched and/or up-regulated in Drd2-neurons in response to cocaine identified a set of miRNAs that are likely to play a role in cocaine addiction.


Figures

Figure 1.
Figure 1.
Ago2 is dispensable for brain organization and neuronal maintenance in the adult brain. (A) Conditional inactivation of Ago2 in adult neurons. Expression of Ago2 was analyzed by Western blotting of the striatal protein lysates derived from three Ago2fl/fl mice (lanes 1–3), and three Camk2a-Cre; Ago2fl/fl mice (lanes 4–6). The lysates derived from Ago2−/− and WT mouse embryonic fibroblasts (MEF) were used as controls for the specificity of the anti-Ago2 antibodies. Equal protein concentration in the samples was controlled by β actin loading. (B and C) Ago2 deficiency in the forebrain does not affect brain morphology. (B) The overall brain morphology of 12-wk-old Camk2a-Cre; Ago2fl/fl and Ago2fl/fl control mice was analyzed using standard Nissl-stain (n = 3/genotype). Two representative images from sagittal brain sections of mice of both genotypes are shown. (C) Saggital brain sections of Ago2fl/fl and Camk2a-Cre; Ago2fl/fl mice are shown (n = 3/genotype). Striatal morphology was analyzed by visualizing Drd1 and Drd2 MSNs (top) using antibodies against the MSN-enriched protein DARPP-32 (green) and the Drd2-MSN–specific adenosine 2A (A2A) receptor (red); the dopaminergic terminals (bottom) were visualized by expression of the dopamine-producing enzyme TH (green), and neuronal nuclei in the striatum were visualized by using the neuron-specific marker NeuN (red). The nucleus of each cell was visualized using Draq5 DNA staining (blue). Bar, 100 µm.
Figure 2.
Figure 2.
Ago2 controls the motivation to self-administer cocaine in mice. (A) Ago2 controls cocaine intake in mice. Cocaine self-administration was measured for Drd2-Cre; Ago2fl/fl (n = 12) and Ago2fl/fl control littermates (n = 10). Graph represents the number of cocaine infusions (0.3 mg/kg/infusion) earned under a FR5TO20 s schedule of reinforcement over 10 consecutive days. (B) Ago2 deficiency in Drd2-expressing MSNs results in a downward shift in the cocaine D–R curve. The unit dose of cocaine available for self-administration was varied according to a within-subjects Latin square design (0.3 mg/kg/infusion), and the effects of responding to each dose of cocaine were assessed in Drd2-Cre; Ago2fl/fl mice (n = 12) and Ago2fl/fl controls (n = 10). Data are presented as number of cocaine infusions earned on the last day of access to each dose of cocaine. (C) Loss of Ago2 in Drd2 neurons abolishes conditional place preference to cocaine. Drd2-Cre; Ago2fl/fl (n = 11) and Ago2fl/fl control (n = 5) mice were tested for their preference for an environment associated with cocaine versus saline injections and the percentage of time (%) spent in the saline or cocaine-paired side is shown. (D) Ago2 does not control food reward. The response for food reward was assessed in Drd2-Cre; Ago2fl/fl (n = 12) and Ago2fl/fl (n = 10) littermate controls. Mice responded for food under a FR5TO20 s schedule of reinforcement. No differences in operant performance were detected between genotypes. (E and F) Ago2 does not control acute cocaine-induced locomotor activity (E) or cocaine-induced anxiety (F). Open field analysis was used to measure locomotor activity and thigmotaxis in Drd2-Cre; Ago2fl/fl and Ago2fl/fl control mice (n = 8/genotype) at basal level (10 min), followed by 100 µl i.p. saline injection (for 10 min), followed by acute cocaine injection (20 mg/kg i.p., 60 min). The bar graphs represent the total distance moved (in centimeters; E) and the ratio of total distance moved in the center versus total arena (F). Statistical analysis was performed using a two-way ANOVA (A–D) and a repeated measure two-way ANOVA (E and F). Data are shown as means; error bars represent ± SEM. *, P < 0.05; **, P < 0.01; ***, P < 0.001.
Figure 3.
Figure 3.
Ago2 regulates the expression of miRNAs in striatal neurons. (A) Ago2-dependent miRNAs. The bar graph displays miRNAs that are down-regulated in the striatum of Camk2a-Cre; Ago2fl/fl mice as compared with Ago2fl/fl control mice (n = 6/genotype). The miRNAs are ordered according to the degree of their down-regulation. (B) Ago2-dependent 3p miRNAs are enriched for A/U at their 5′ position. Logo diagrams display all 3p Ago2-dependent and 3p Ago2-independent miRNAs in the striatum of Camk2a-Cre; Ago2fl/fl mice as compared with Ago2fl/fl control mice (n = 6/genotype). The height of each row corresponds to the sequence conservation at specific positions, and the height of individual letters within a row corresponds to the prevalence of that specific nucleotide (nt). Sequences ranging from 30 nt upstream to 48 nt after the first nucleotide of the mature miRNA sequence are depicted. The 5′-nt of the mature miRNA sequence is located at position 0 (indicated by the beginning of the red bar). 3p miRNAs down-regulated in the striatum of Camk2a-Cre; Ago2fl/fl (top) show higher occurrence of A or U at the 5′-nt of the mature miRNA than 3p miRNAs that are unaffected by the loss of Ago2 (bottom). The table displays the percentage of Ago2-dependent (left) and Ago2–independent (right) 3p miRNAs that have an A/U versus a C/G at their 5′-position.
Figure 4.
Figure 4.
Ago2-dependent miRNAs in Drd2 neurons are induced by cocaine and regulate genes involved in cocaine addiction. (A) Ago2-regulated miRNAs in Drd2 neurons are induced by cocaine. The Venn diagram shows the number of miRNAs that are down-regulated (>1.5 fold) in the striatum of Camk2a-Cre; Ago2fl/fl mice (blue; n = 6/genotype) and miRNAs that are up-regulated (>1.45-fold) in Drd2 neurons in response to acute cocaine as compared with saline injections (red; n = 3/genotype). The overlapping miRNAs are shown in yellow. The bar graph displays all 23 miRNAs that are up-regulated in response to acute cocaine in Drd2 neurons (blue bars) and down-regulated in the absence of Ago2 in the striatum (red bars). RQ of each miRNA was calculated using the ΔΔCt method; a maximum standard deviation for the ΔCt values of 0.8 was used as a cut-off for each miRNA. (B) Ago2-dependent, induced by cocaine and Drd2-enriched (ADICD) miRNAs regulate genes important in cocaine addiction. The bar graph displays the average percentage of luciferase expression of FosB-, Mef2d-, and Cdk5r1- 3′ UTR-luciferase vectors in the presence of miR-369-3p, miR-324-5p, or a scrambled control as compared with their respective vector controls. Each sample was analyzed in triplicates, and three independent experiments were performed. Statistical analysis was performed using Student’s t test. Error bars indicate + SEM. *, P < 0.05; **, P < 0.01.

Similar articles

Cited by

References

    1. Bibb J.A., Chen J., Taylor J.R., Svenningsson P., Nishi A., Snyder G.L., Yan Z., Sagawa Z.K., Ouimet C.C., Nairn A.C., et al. 2001. Effects of chronic exposure to cocaine are regulated by the neuronal protein Cdk5. Nature. 410:376–380 10.1038/35066591 - DOI - PubMed
    1. Caine S.B., Negus S.S., Mello N.K., Patel S., Bristow L., Kulagowski J., Vallone D., Saiardi A., Borrelli E. 2002. Role of dopamine D2-like receptors in cocaine self-administration: studies with D2 receptor mutant mice and novel D2 receptor antagonists. J. Neurosci. 22:2977–2988 - PMC - PubMed
    1. Casanova E., Fehsenfeld S., Mantamadiotis T., Lemberger T., Greiner E., Stewart A.F., Schütz G. 2001. A CamKIIalpha iCre BAC allows brain-specific gene inactivation. Genesis. 31:37–42 10.1002/gene.1078 - DOI - PubMed
    1. Chandrasekar V., Dreyer J.L. 2009. microRNAs miR-124, let-7d and miR-181a regulate cocaine-induced plasticity. Mol. Cell. Neurosci. 42:350–362 10.1016/j.mcn.2009.08.009 - DOI - PubMed
    1. Chao J., Nestler E.J. 2004. Molecular neurobiology of drug addiction. Annu. Rev. Med. 55:113–132 10.1146/annurev.med.55.091902.103730 - DOI - PubMed

Publication types