. 2010 Oct 1;285(40):30779-91.
doi: 10.1074/jbc.M110.140475. Epub 2010 Jul 19.

Deletions and mutations in the acidic lipid-binding region of the plasma membrane Ca2+ pump: a study on different splicing variants of isoform 2

Affiliations

Deletions and mutations in the acidic lipid-binding region of the plasma membrane Ca2+ pump: a study on different splicing variants of isoform 2

Marisa Brini et al. J Biol Chem. .

Abstract

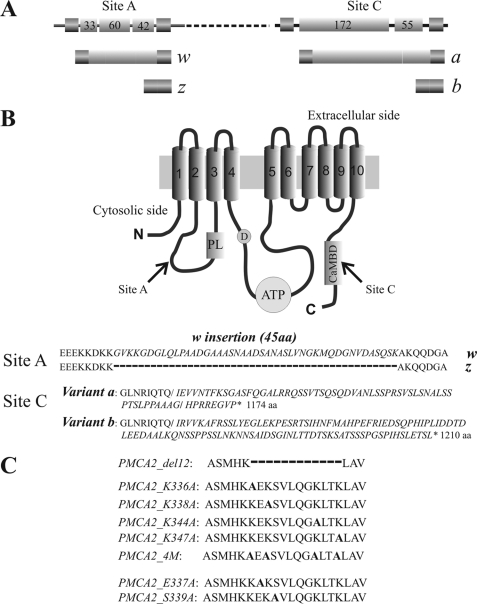
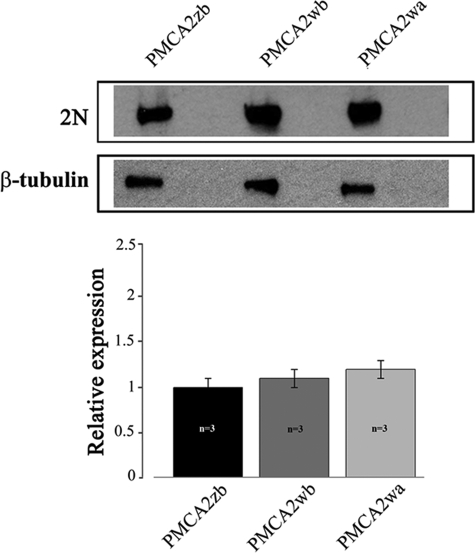
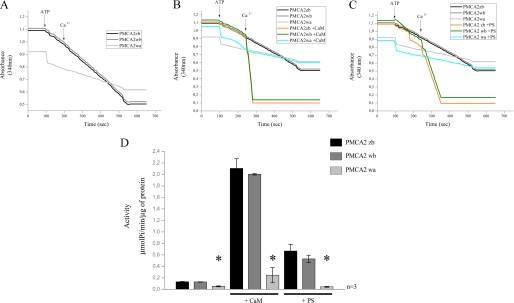
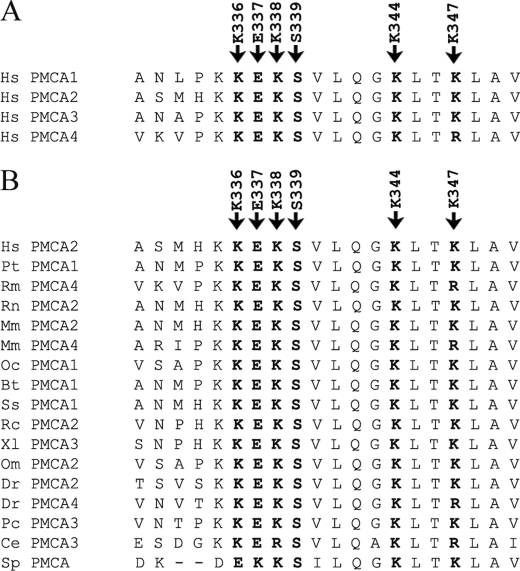
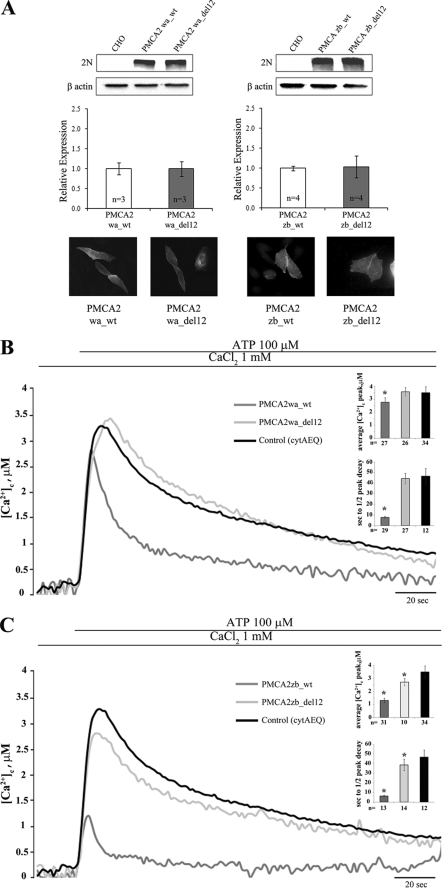
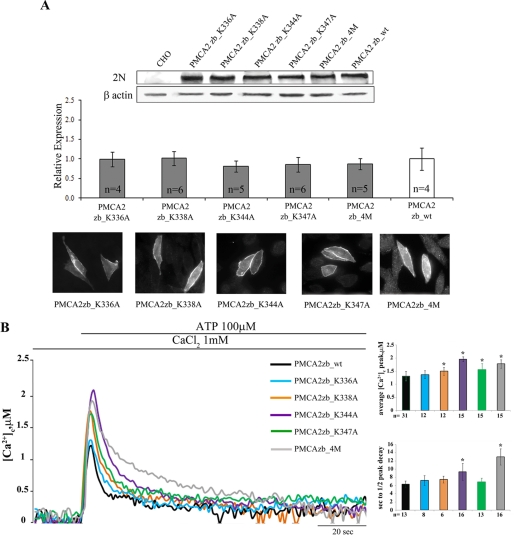
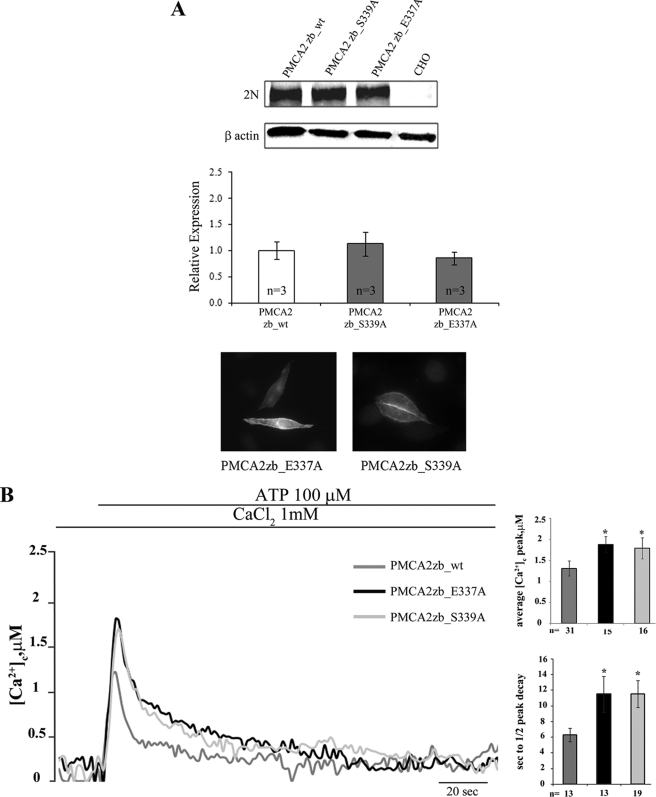
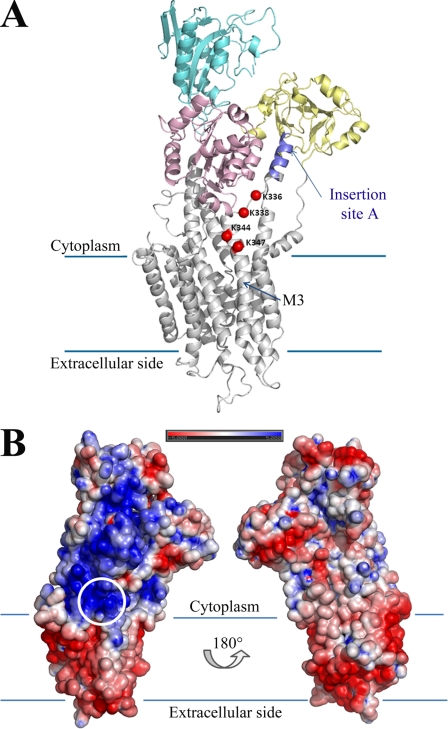
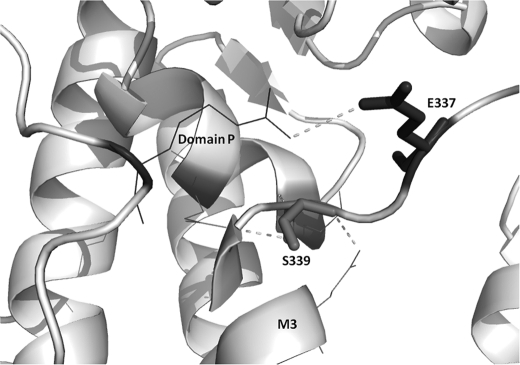
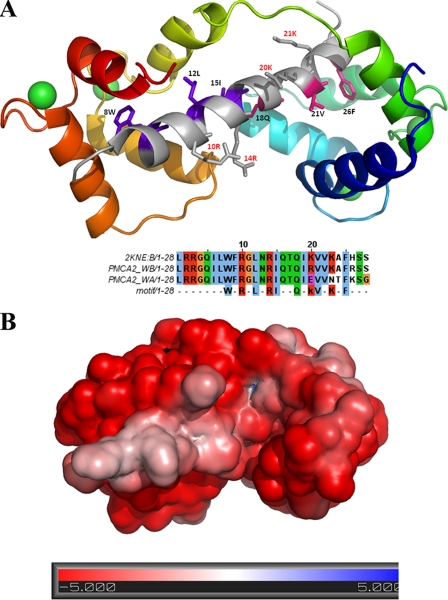
Acidic phospholipids increase the affinity of the plasma membrane Ca(2+)-ATPase pump for Ca(2+). They interact with the C-terminal region of the pump and with a domain in the loop connecting transmembrane domains 2 and 3 (A(L) region) next to site A of alternative splicing. The contribution of the two phospholipid-binding sites and the possible interference of splicing inserts at site A with the regulation of the ATPase activity of isoform 2 of the pump by phospholipids have been analyzed. The activity of the full-length z/b variant (no insert at site A), the w/b (with insert at site A), and the w/a variant, containing both the 45-amino acid A-site insert and a C-site insert that truncates the pump in the calmodulin binding domain, has been analyzed in microsomal membranes of overexpressing CHO cells. The A-site insertion did not modify the phospholipid sensitivity of the pump, but the doubly inserted w/a variant became insensitive to acidic phospholipids, even if containing the intact A(L) phospholipid binding domain. Pump mutants in which 12 amino acids had been deleted, or single lysine mutations introduced, in the A(L) region were studied by monitoring agonist-induced Ca(2+) transients in overexpressing CHO cells. The 12-residue deletion completely abolished the ATPase activity of the w/a variant but only reduced that of the z/b variant, which was also affected by the single lysine substitutions in the same domain. A structural interpretation of the interplay of the pump with phospholipids, and of the mechanism of their activation, is proposed on the basis of molecular modeling studies.


Figures

FIGURE 1.
FIGURE 1.
A, linear representation of the alternative splicing options at site A and site C of the PMCA2 transcript. Exons are indicated by shadow boxes and introns by the black line. The numbers in the boxes represent the nucleotide number of each exon. B, topography model of the plasma membrane Ca2+-ATPase and sequences of alternative splicing products of isoform 2. The 10 putative transmembrane domains are numbered and indicated by shadow boxes. PL indicates the phospholipid binding domain downstream of site A of alternative splicing; D indicates the catalytic aspartate; ATP and CaMBD indicate the ATP-binding site and the calmodulin binding domain, which contains site C of alternative splicing. C, sequences of the PMCA2 region that have been mutated or deleted in the constructs used in this study. The alanine that replaces the mutated residue in the different constructs is indicated in bold. The dashed line represents the 12 amino acids deletion.
FIGURE 2.
FIGURE 2.
Western blotting and densitometric analysis of PMCA2 isoform overexpression in transfected CHO cells. 20 μg of crude membrane proteins from transfected CHO cells, prepared by a freeze and thaw method, were separated by SDS-PAGE as described under “Experimental Procedures” and stained with polyclonal antibody 2N, which recognizes isoform 2 of the pump or against tubulin. The lanes correspond to cells transfected with the indicated variants of PMCAs fused to GFP. The data are representative of at least three independent experiments.
FIGURE 3.
FIGURE 3.
A, comparison of Ca2+ transport activity measured on microsomal membranes isolated from CHO cells overexpressing PMCA2 z/b, w/b, and w/a variants. Membranes vesicles were preincubated at 37 °C, and Ca2+ uptake was initiated by the addition of 4 mm ATP (where indicated). 50 μm CaCl2 was added where indicated. B, CaM dependence of Ca2+ uptake by microsomal membranes preincubated at 37 °C with 200 nm CaM. C, acidic phospholipid (PS) dependence of Ca2+ uptake by microsomal membranes preincubated at 37 °C with 25 μm PS. A–C, ATPase activity was indicated as the decrease of the absorbance at 340 nm. D, histograms show the means ± S.D. of the activity of the pumps. The activity was expressed as micromoles of Pi/min/μg of protein and calculated as indicated under “Experimental Procedures.” The data are representative of at least three experiments with different membranes preparations. *, p < 0.05, in respect to the respective controls in the absence of CaM and PS.
FIGURE 4.
FIGURE 4.
ClustalW analysis of the AL domain and the conservation of mutated residues. The similarity analysis was performed using the ClustalW program. Human PMCA2 sequence (GenBankTM accession number NP_001674) is listed with other human PMCAs isoforms sequences (A) and with those of other species (B). GenBankTM accession numbers are as follows: NP_001001323 (Homo sapiens PMCA1), NP_068768 (H. sapiens PMCA3), NP_001675 (H. sapiens PMCA4), XP_509257 (Pan troglodytes PMCA1), AY928176 (Rhesus macaque PMCA4), NP_036640 (Rattus norvegicus PMCA2), AAH75643 (Mus musculus PMCA2), BC109173 (M. musculus PMCA4), Q00804 (Oryctolagus cuniculus PMCA1), NP_777121 (Bos taurus PMCA1), NP_999517 (Sus scrofa PMCA1), AAK11272 (Rana catesbeiana PMCA2), BC077905 (Xenopus laevis PMCA3), P58165 (Oreochromis mossambicus PMCA2), NP_001116710 (Danio rerio PMCA2), EU559285 (D. rerio PMCA4), AAR28532 (Procambarus clarkia PMCA3), AAK68551 (Caenorhabditis elegans PMCA3) and AAR13013 (Stylophora pistillata).
FIGURE 5.
FIGURE 5.
A, Western blotting and densitometric analysis of the variants of the PMCA2 isoform overexpressed in CHO cells. 20 μg of crude membrane proteins from transfected CHO cells, prepared by a freeze and thaw method, were separated by SDS-PAGE as described under “Experimental Procedures” and stained with polyclonal antibody 2N. The control lane corresponds to nontransfected cells (CHO). The other lanes correspond to cells transfected with the WT or mutant variants of the PMCA2 pump. The panel also shows the immunocytochemistry analysis of the transfected CHO cells. The immunostaining was carried out with the 2N antibody and revealed with the secondary antibody Alexa Fluor 594. B, monitoring of cytosolic [Ca2+] in CHO cells transfected with cytAEQ and co-transfected with cytAEQ and the WT w/a variant of PMCA2 isoform or deleted PMCA2wa_del12 mutant. C, monitoring of cytosolic [Ca2+] in CHO cells transfected with cytAEQ and co-transfected with cytAEQ and the wt z/b variant of PMCA2 isoform or deleted PMCA2zb_del12 mutant. The histograms in B and C show the means ± S.D. of [Ca2+]c peaks and of the half-time decays from the peaks. The traces are representative of at least 12 independent experiments. *, p < 0.01 calculated with respect to control (CHO cells transfected only with cytAEQ).
FIGURE 6.
FIGURE 6.
A, Western blotting and densitometric analysis of the Lys mutants of the PMCA2 z/b isoform overexpressed in CHO cells. 20 μg of crude membrane proteins from transfected CHO cells, prepared by a freeze and thaw method, were separated by SDS-PAGE as described under “Experimental Procedures” and stained with polyclonal antibody 2N. The control lane corresponds to nontransfected cells (CHO). The other lanes correspond to cells transfected with the WT or mutant variants of the PMCA2 pump. The panel also shows the immunocytochemistry analysis of the transfected CHO cells. The immunostaining was carried out with the 2N antibody and revealed with the secondary antibody Alexa Fluor 594. B, monitoring of cytosolic [Ca2+] in CHO cells transfected with cytAEQ and co-transfected with cytAEQ and the PMCA2zb_K336A, PMCA2zb_K338A, PMCA2zb_K344A, PMCA2zb_K347A, or PMCA2zb_4M, alternatively. The histograms show the means ± S.D. of [Ca2+]c peaks and of the half-time decays from the peaks. The traces are representative of at least 12 independent experiments. *, p < 0.01 calculated with respect to PMCA2zb_wt (CHO cells transfected with wt PMCA2 z/b pump).
FIGURE 7.
FIGURE 7.
A, Western blotting and densitometric analysis of the Glu and Ser mutants of the PMCA2 z/b isoform overexpressed in CHO cells. 20 μg of crude membrane proteins from transfected CHO cells, prepared by a freeze and thaw method, were separated by SDS-PAGE as described under “Experimental Procedures” and stained with polyclonal antibody 2N. The control lane corresponds to nontransfected cells (CHO). The other lanes correspond to cells transfected with the WT or mutants variants of the PMCA2 pump. The panel also shows the immunocytochemistry analysis of the transfected CHO cells. The immunostaining was carried out with the 2N antibody and revealed with the secondary antibody Alexa Fluor 594. B, monitoring of cytosolic [Ca2+] in CHO cells transfected with cytAEQ and co-transfected with cytAEQ and the PMCA2zb_E337A or the PMCA2zb_S339A. The histograms show the means ± S.D. of [Ca2+]c peaks and of the half-time decays from the peaks. The traces are representative of at least 12 independent experiments. *, p < 0.01 calculated with respect to PMCA2zb_wt (CHO cells transfected with WT PMCA2 z/b pump).
FIGURE 8.
FIGURE 8.
A, overview of the PMCA2 model, shown in schematics and color-coded for the different canonical domains, with the four mutated lysines highlighted as red spheres. The approximate location of the membrane limits are shown with lines, and the third transmembrane helix is labeled as M3. Note that the C-terminal part of PMCA2 from residue 1088 onward could not be modeled. Insertion site A is highlighted. B, electrostatic potential of the PMCA2 accessible surface. The structure is shown in the same orientation as in A and rotated around the central axis (right). The location of the mutated lysine residues is circled. Note how the area around and between the four lysines and insertion site A is the only PMCA2 region with positive potential in contact with the membrane.
FIGURE 9.
FIGURE 9.
Representation of the two residues, Ser-337 and Glu-339 (dark gray). These are shown as sticks, and dashed lines indicate interatomic contacts or hydrogen bonds with neighboring residues.
FIGURE 10.
FIGURE 10.
A, structural model of the calmodulin-binding region of PMCA2 (top) and relative sequence alignment (bottom). The amphipathic PMCA2 helix is shown in gray at the center of the structure, with residues in purple and pink defining the N- and C-terminal motifs. The calmodulin structure is shown with progressively varying color, from blue (N terminus) to red (C terminus). Ca2+ ions are shown as green spheres. The sequence alignment shows the structural template (PMCA4, PDB code 2KNE) together with two PMCA2 variants. The last line defines the sequence motif for calmodulin binding. Note how PMCA2 w/a lacks two crucial lysine residues for the second motif. B, electrostatic surface of the calmodulin-binding region of PMCA2 with bound CaM in the same orientation as in A.

Similar articles

Cited by

References

    1. Brini M., Coletto L., Pierobon N., Kraev N., Guerini D., Carafoli E. (2003) J. Biol. Chem. 278, 24500–24508 - PubMed
    1. Brini M., Carafoli E. (2009) Physiol. Rev. 89, 1341–1378 - PubMed
    1. Rimessi A., Coletto L., Pinton P., Rizzuto R., Brini M., Carafoli E. (2005) J. Biol. Chem. 280, 37195–37203 - PubMed
    1. Linde C. I., Di Leva F., Domi T., Tosatto S. C., Brini M., Carafoli E. (2008) Cell Calcium 43, 550–561 - PubMed
    1. Chicka M. C., Strehler E. E. (2003) J. Biol. Chem. 278, 18464–18470 - PubMed

Publication types

MeSH terms

LinkOut - more resources