Modular utilization of distal cis-regulatory elements controls Ifng gene expression in T cells activated by distinct stimuli
- PMID: 20643337
- PMCID: PMC2994316
- DOI: 10.1016/j.immuni.2010.07.004
Modular utilization of distal cis-regulatory elements controls Ifng gene expression in T cells activated by distinct stimuli
Abstract
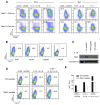
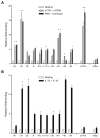
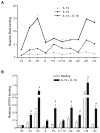
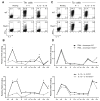
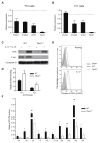
Distal cis-regulatory elements play essential roles in the T lineage-specific expression of cytokine genes. We have mapped interactions of three trans-acting factors-NF-kappaB, STAT4, and T-bet-with cis elements in the Ifng locus. We find that RelA is critical for optimal Ifng expression and is differentially recruited to multiple elements contingent upon T cell receptor (TCR) or interleukin-12 (IL-12) plus IL-18 signaling. RelA recruitment to at least four elements is dependent on T-bet-dependent remodeling of the Ifng locus and corecruitment of STAT4. STAT4 and NF-kappaB therefore cooperate at multiple cis elements to enable NF-kappaB-dependent enhancement of Ifng expression. RelA recruitment to distal elements was similar in T helper 1 (Th1) and effector CD8(+) T (Tc1) cells, although T-bet was dispensable in CD8 effectors. These results support a model of Ifng regulation in which distal cis-regulatory elements differentially recruit key transcription factors in a modular fashion to initiate gene transcription induced by distinct activation signals.
Copyright 2010 Elsevier Inc. All rights reserved.
Figures


Similar articles
-
Deletion of a conserved cis-element in the Ifng locus highlights the role of acute histone acetylation in modulating inducible gene transcription.PLoS Genet. 2014 Jan;10(1):e1003969. doi: 10.1371/journal.pgen.1003969. Epub 2014 Jan 9. PLoS Genet. 2014. PMID: 24415943 Free PMC article.
-
Signal transducer and activator of transcription 4 is required for the transcription factor T-bet to promote T helper 1 cell-fate determination.Immunity. 2008 Nov 14;29(5):679-90. doi: 10.1016/j.immuni.2008.08.017. Immunity. 2008. PMID: 18993086 Free PMC article.
-
Stat4 is critical for the balance between Th17 cells and regulatory T cells in colitis.J Immunol. 2011 Jun 1;186(11):6597-606. doi: 10.4049/jimmunol.1004074. Epub 2011 Apr 27. J Immunol. 2011. PMID: 21525389 Free PMC article.
-
Epigenetics and T helper 1 differentiation.Immunology. 2009 Mar;126(3):299-305. doi: 10.1111/j.1365-2567.2008.03026.x. Epub 2008 Dec 18. Immunology. 2009. PMID: 19178593 Free PMC article. Review.
-
Regulation of the Ifng locus in the context of T-lineage specification and plasticity.Immunol Rev. 2010 Nov;238(1):216-32. doi: 10.1111/j.1600-065X.2010.00961.x. Immunol Rev. 2010. PMID: 20969595 Free PMC article. Review.
Cited by
-
T-bet Activates Th1 Genes through Mediator and the Super Elongation Complex.Cell Rep. 2016 Jun 21;15(12):2756-70. doi: 10.1016/j.celrep.2016.05.054. Epub 2016 Jun 9. Cell Rep. 2016. PMID: 27292648 Free PMC article.
-
Deletion of a conserved cis-element in the Ifng locus highlights the role of acute histone acetylation in modulating inducible gene transcription.PLoS Genet. 2014 Jan;10(1):e1003969. doi: 10.1371/journal.pgen.1003969. Epub 2014 Jan 9. PLoS Genet. 2014. PMID: 24415943 Free PMC article.
-
High-resolution nucleosome mapping of targeted regions using BAC-based enrichment.Nucleic Acids Res. 2013 Apr;41(7):e87. doi: 10.1093/nar/gkt081. Epub 2013 Feb 14. Nucleic Acids Res. 2013. PMID: 23413004 Free PMC article.
-
IL-18-secreting multiantigen targeting CAR T cells eliminate antigen-low myeloma in an immunocompetent mouse model.Blood. 2024 Jul 11;144(2):171-186. doi: 10.1182/blood.2023022293. Blood. 2024. PMID: 38579288
-
NF-κB in Cancer Immunity: Friend or Foe?Cells. 2021 Feb 9;10(2):355. doi: 10.3390/cells10020355. Cells. 2021. PMID: 33572260 Free PMC article. Review.
References
-
- Afkarian M, Sedy JR, Yang J, Jacobson NG, Cereb N, Yang SY, Murphy TL, Murphy KM. T-bet is a STAT1-induced regulator of IL-12R expression in naive CD4+ T cells. Nat Immunol. 2002;3:549–557. - PubMed
-
- Agarwal S, Rao A. Modulation of chromatin structure regulates cytokine gene expression during T cell differentiation. Immunity. 1998;9:765–775. - PubMed
-
- Ansel KM, Djuretic I, Tanasa B, Rao A. Regulation of Th2 differentiation and Il4 locus accessibility. Annu Rev Immunol. 2006;24:607–656. - PubMed
-
- Beg AA, Sha WC, Bronson RT, Ghosh S, Baltimore D. Embryonic lethality and liver degeneration in mice lacking the RelA component of NF-κB. Nature. 1995;376:167–170. - PubMed
-
- Berenson LS, Gavrieli M, Farrar JD, Murphy TL, Murphy KM. Distinct characteristics of murine STAT4 activation in response to IL-12 and IFN-α. J Immunol. 2006;177:5195–5203. - PubMed
Publication types
MeSH terms
Substances
Grants and funding
- R01 AI035783/AI/NIAID NIH HHS/United States
- R01 AI077574-01A2/AI/NIAID NIH HHS/United States
- R01 AI035783-10/AI/NIAID NIH HHS/United States
- AI35098/AI/NIAID NIH HHS/United States
- R24 DK064400/DK/NIDDK NIH HHS/United States
- R01 AI035783-11/AI/NIAID NIH HHS/United States
- R21 AI035783/AI/NIAID NIH HHS/United States
- R24 DK064400-019003/DK/NIDDK NIH HHS/United States
- AI35783/AI/NIAID NIH HHS/United States
- K22HG003169/HG/NHGRI NIH HHS/United States
- R01 AI077574-02/AI/NIAID NIH HHS/United States
- R37 AI035098/AI/NIAID NIH HHS/United States
- AI77574/AI/NIAID NIH HHS/United States
- R01 AI035783-13/AI/NIAID NIH HHS/United States
- R01 AI077574/AI/NIAID NIH HHS/United States
- K22 HG003169/HG/NHGRI NIH HHS/United States
- R01 AI035098/AI/NIAID NIH HHS/United States
- R01 AI035783-12/AI/NIAID NIH HHS/United States
LinkOut - more resources
Full Text Sources
Other Literature Sources
Molecular Biology Databases
Research Materials
Miscellaneous

