. 2010 Jul 12;5(7):e11540.
doi: 10.1371/journal.pone.0011540.

Splice-site mutations cause Rrp6-mediated nuclear retention of the unspliced RNAs and transcriptional down-regulation of the splicing-defective genes

Affiliations

Splice-site mutations cause Rrp6-mediated nuclear retention of the unspliced RNAs and transcriptional down-regulation of the splicing-defective genes

Andrea B Eberle et al. PLoS One. .

Abstract

Background: Eukaryotic cells have developed surveillance mechanisms to prevent the expression of aberrant transcripts. An early surveillance checkpoint acts at the transcription site and prevents the release of mRNAs that carry processing defects. The exosome subunit Rrp6 is required for this checkpoint in Saccharomyces cerevisiae, but it is not known whether Rrp6 also plays a role in mRNA surveillance in higher eukaryotes.

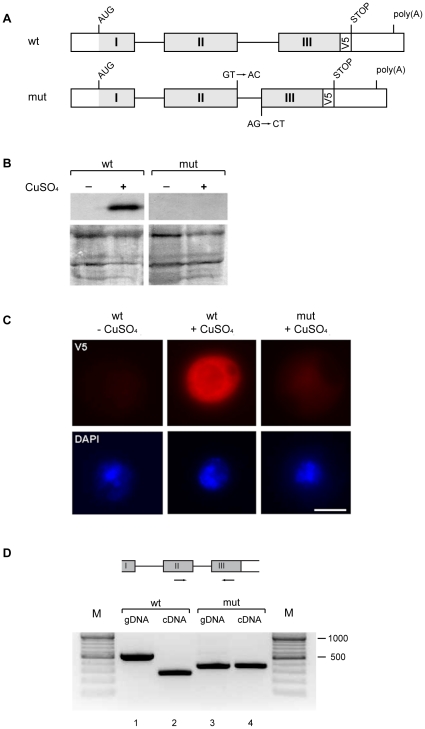
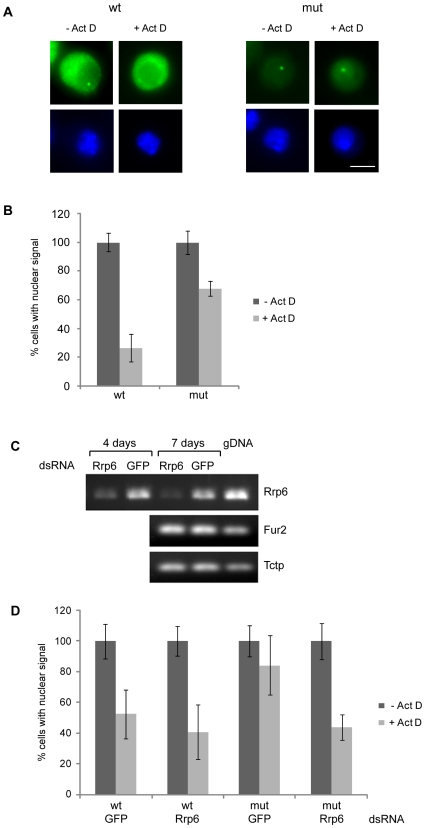
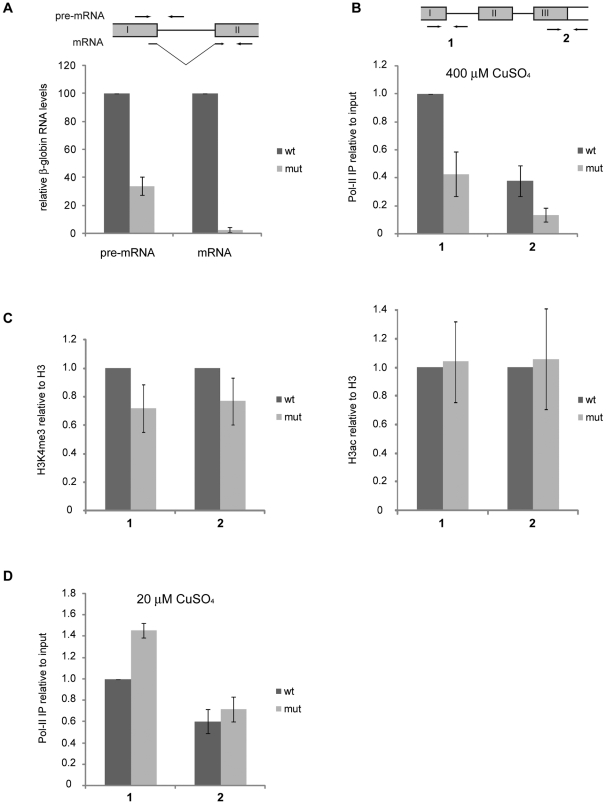
Methodology/principal findings: We have developed an in vivo system to study nuclear mRNA surveillance in Drosophila melanogaster. We have produced S2 cells that express a human beta-globin gene with mutated splice sites in intron 2 (mut beta-globin). The transcripts encoded by the mut beta-globin gene are normally spliced at intron 1 but retain intron 2. The levels of the mut beta-globin transcripts are much lower than those of wild type (wt) ss-globin mRNAs transcribed from the same promoter. We have compared the expression of the mut and wt beta-globin genes to investigate the mechanisms that down-regulate the production of defective mRNAs. Both wt and mut beta-globin transcripts are processed at the 3', but the mut beta-globin transcripts are less efficiently cleaved than the wt transcripts. Moreover, the mut beta-globin transcripts are less efficiently released from the transcription site, as shown by FISH, and this defect is restored by depletion of Rrp6 by RNAi. Furthermore, transcription of the mut beta-globin gene is significantly impaired as revealed by ChIP experiments that measure the association of the RNA polymerase II with the transcribed genes. We have also shown that the mut beta-globin gene shows reduced levels of H3K4me3.

Conclusions/significance: Our results show that there are at least two surveillance responses that operate cotranscriptionally in insect cells and probably in all metazoans. One response requires Rrp6 and results in the inefficient release of defective mRNAs from the transcription site. The other response acts at the transcription level and reduces the synthesis of the defective transcripts through a mechanism that involves histone modifications.


Conflict of interest statement

Competing Interests: The authors have declared that no competing interests exist.

Figures

Figure 1
Figure 1. The human β-globin genes expressed in Drosophila S2 cells.
(A) Schematic representation of the β-globin transcripts expressed in S2 cells. The grey boxes represent the coding β-globin sequences. The white boxes indicate the 5′ UTR and 3′ UTR of the pMT vector (see Materials and Methods S1 for details). The box marked V5 indicates the position of the V5 tag. The mut RNA carries a shorter intron 2 and mutations in both the 5′ and 3′ splice sites of intron 2, as indicated in the figure. (B) Western blot analysis of the expression of the wt and mut β-globin genes. The expression of the β-globin genes was induced with 500 µM CuSO4 for 24 h and analyzed by Western blotting using the anti-V5 antibody. Protein expression was detected only from the wt construct. As a loading reference, a section of the PVDF filter containing proteins in the 50–90 kDa range was stained for total protein with Coomassie blue. (C) The expression of the β-globin genes analyzed by immunofluorescence. Expression of the wt and mut β-globin genes was induced as described above and the cells were stained with the anti-V5 antibody (red) to visualize β-globin expression. DAPI counterstaining was used to visualize the nuclei (blue). Exposure times were the same for all images. The magnification bar represents 5 µm. (D) The β-globin transcripts analyzed by RT-PCR. The expression of the wt and mut β-globin genes was induced as described above. Total RNA was purified and reverse-transcribed, and the β-globin sequences were amplified by PCR primers flanking intron 2, as indicated in the figure (lanes 2 and 4). The genomic DNA isolated from β-globin wt or mut S2 cells was used in parallel to check the splicing pattern (gDNA, lanes 1 and 3). Molecular mass standards are shown (M) and the length of the major bands is indicated in bp.
Figure 2
Figure 2. Nuclear retention of mutant β-globin transcripts in S2 cells.
(A) The location of the β-globin RNAs studied by FISH. Expression of the wt and mut β-globin genes was induced with 400 µM CuSO4 for 24 h and the location of the β-globin transcripts was analyzed by FISH. The β-globin sequence of the pβΔRS plasmid was labeled with digoxigenin and used as a probe (green). The preparations were counterstained with DAPI (blue). When indicated, the cells were treated with actinomycin D before fixation to study the presence of transcripts at the transcription site in the absence of ongoing RNA synthesis. The magnification bar represents 5 µm. (B) Quantitative analysis of the FISH experiments. The frequency of cells with an intensely fluorescent spot in the nucleus was counted in control cells (Act-, dark bars) and in cells treated with actinomycin D (Act+, light bars). For each treatment, 98 cells were analyzed. The experiment was carried out three independent times, with a total of 294 cells analyzed. To show the changes induced by actinomycin D, the results are expressed as average percentage relative to the frequencies obtained in non-treated cells. The error bars represent standard deviations of the mean (n = 3). Comparisons of wt to mut treated with actinomycin D using a paired, one-tailed Student's t-test gave p = 0.02, n = 3. (C) Depletion of Rrp6 by RNAi in S2 cells. S2 cells were treated with either Rrp6-dsRNA or control GFP-dsRNA. After 4 days or 7 days, as indicated, total RNA was purified and reverse-transcribed. The resulting cDNA was analyzed by PCR with primers specific for the rrp6 gene. The expressions of two unrelated genes, fur2 and tctp, were analyzed in parallel to assess the specificity of the treatment. Genomic DNA was analyzed in parallel. Equivalent amounts of cells expressing wt and mut transcripts were used for the analysis. (D) Depletion of Rrp6 restores the release of β-globin transcripts from the transcription site. The distribution of the β-globin transcripts was analyzed by FISH in cells treated with either Rrp6-dsRNA or GFP-dsRNA for 5 days. Induction, actinomycin treatment and FISH analysis were the same as those described for Figures 2A and 2B. The histogram shows the average proportion of cells with an intense fluorescent spot. Dark bars indicate data from non-treated control cells. Light bars correspond to cells treated with actinomycin D before fixation and FISH analysis. A total of 392 cells from two independent experiments, each in duplicate, was analyzed for each treatment. The error bars represent standard deviations (n = 4). Comparisons of cells expressing mut RNA and treated with Rrp6-dsRNA with those treated with GFP-dsRNA in the presence of actinomycin D using an unpaired, one-tailed Student's t-test gave p = 0.03, n = 4.
Figure 3
Figure 3. Cleavage and polyadenylation of the β-globin transcripts.
(A) Detection of the downstream cleavage product (3′ fragment). The expression of Rat1 was silenced by RNAi in S2 cells expressing either mut or wt β-globin. Control cells were treated in parallel with GFP-dsRNA. Total RNA was purified and reverse-transcribed from dsRNA-treated cells, and the resulting cDNAs were quantified by qPCR with primers specific for the pre-mRNA, the mRNA (see Figure 4A) and the 3′ fragment (see the schematic picture above the histogram). The histogram shows the average values and standard deviations of β-globin levels, normalized to actin 5C RNA, from three independent experiments with two qPCR runs each (n = 6). The relative accumulation of downstream product was less pronounced in cells that expressed the mut β-globin gene than in cells that expressed the wt gene (p<0.01 using a paired, two-tailed Student's t-test, n = 6). (B) PCR-based detection of polyadenylated β-globin transcripts. Total RNA was purified from nuclear preparations of S2 cells expressing either mut or wt β-globin genes. The resulting cDNAs were used to amplify polyadenylated β-globin sequences by PCR with a 26 nt-long downstream primer complementary to the beginning of the poly(A) tail, as indicated in the figure (lanes 14). Control reactions with a 16 nt-long primer lacking the oligo(dT) extension were processed in parallel to rule out poly(A)-independent priming (lanes 58). Contamination with genomic DNA was assessed in parallel reactions without reverse transcriptase (RT-). (C) RT-qPCR quantification of polyadenylated β-globin transcripts. The samples described above were analyzed by RT-qPCR. Relative levels of polyadenylated β-globin transcripts, normalized to the total β-globin RNA, are shown. Values and standard deviations represent the average from two independent experiments with two qPCR runs each (n = 4). No significant differences were observed using a paired, two-tailed Student's t-test (p = 0.12, n = 4).
Figure 4
Figure 4. Expression of the mut and wt β-globin genes in S2 cells.
(A) The relative levels of β-globin transcripts analyzed by RT-qPCR. The expression of the β-globin genes was induced with 400 µM CuSO4, and total RNA was purified and reverse-transcribed. β-globin pre-mRNA and mRNA levels were quantified by RT-qPCR using specific primers as indicated in the figure. The histogram shows average relative transcript levels normalized to actin 5C. The error bars are standard deviations from three independent experiments, each in duplicate (n = 6). Comparisons between wt and mut using a paired, two-tailed Student's t-test gave p<0.001 and p<0.0001 (n = 6) for pre-mRNA and mRNA, respectively. (B) Analysis of Pol-II density in β-globin genes. Expression of the β-globin genes was induced as described above (400 µM CuSO4, high induction conditions) and the density of Pol-II in the mut and wt β-globin genes was analyzed by ChIP using an anti-CTD antibody. Two regions near the promoter (region 1) and the stop codon (region 2) of the β-globin gene were analyzed by qPCR using specific primers as indicated in the figure. The histogram shows average Pol-II signals relative to input and normalized to actin 5C from three independent experiments, each one quantified twice by qPCR (n = 6). The error bars represent standard deviations. Comparisons between wt and mut using a paired, two-tailed Student's t-test gave p<0.0001 and p<0.005 (n = 6) for regions 1 and 2, respectively. (C) Analysis of chromatin modifications in the β-globin genes (400 µM CuSO4, high induction conditions) by ChIP using antibodies against histone H3, H3K4me3 and H3ac. The immunoprecipitated DNA was measured by qPCR using primers for β-globin regions 1 and 2, as in (B). The histograms show the average signals for H3K4me3 (left) and H3ac (right) relative to histone H3 and normalized to actin 5C from three (H3K4me3) and two (H3ac) independent experiments, each quantified in duplicate (n = 6 and n = 4 for H3K4me3 and H3ac, respectively). The error bars represent standard deviations. Comparisons of H3K4me3 occupancy between wt and mut using a paired, two-tailed Student's t-test gave p = 0.06 and p = 0.04 (n = 6) for regions 1 and 2, respectively. No significant differences were found for H3ac (p>0.9 and p>0.8, n = 4, for regions 1 and 2, respectively). (D) Analysis of Pol-II density in β-globin genes under low induction conditions. The density of Pol-II in the mut and wt β-globin genes was analyzed by ChIP as in (B) after induction with 20 µM CuSO4. The histogram shows average Pol-II signal relative to input and normalized to actin 5C from two independent experiments each quantified in duplicate (n = 4). Paired, two-tailed Student's t-test p values for comparisons of Pol-II density between wt and mut were 0.002 and 0.14 (not significant difference) for regions 1 and 2, respectively.

Similar articles

Cited by

References

    1. Dreyfuss G, Kim VN, Kataoka N. Messenger-RNA-binding proteins and the messages they carry. Nat Rev Mol Cell Biol. 2002;3:195–205. - PubMed
    1. Moore MJ. From birth to death: the complex lives of eukaryotic mRNAs. Science. 2005;309:1514–1518. - PubMed
    1. Maniatis T, Reed R. An extensive network of coupling among gene expression machines. Nature. 2002;416:499–506. - PubMed
    1. Neugebauer KM. On the importance of being co-transcriptional. J Cell Sci. 2002;115:3865–3871. - PubMed
    1. Allemand E, Batsché E, Muchardt C. Splicing, transcription, and chromatin: a ménage à trois. Curr Opin Genet Dev. 2008;18:145–151. - PubMed

Publication types

LinkOut - more resources