. 2010 Sep 1;21(17):3070-9.
doi: 10.1091/mbc.E09-12-1044. Epub 2010 Jul 14.

Differential requirements for clathrin-dependent endocytosis at sites of cell-substrate adhesion

Affiliations

Differential requirements for clathrin-dependent endocytosis at sites of cell-substrate adhesion

Erika M Batchelder et al. Mol Biol Cell. .

Abstract

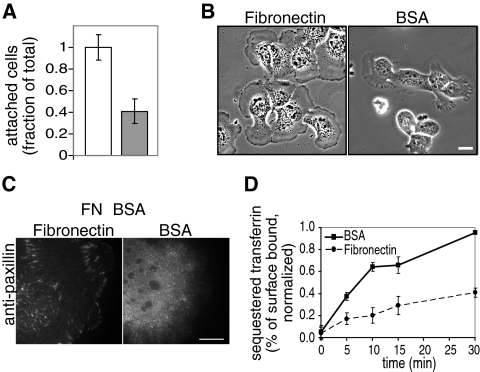
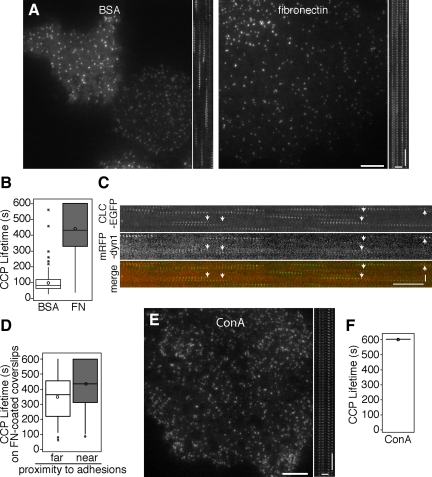
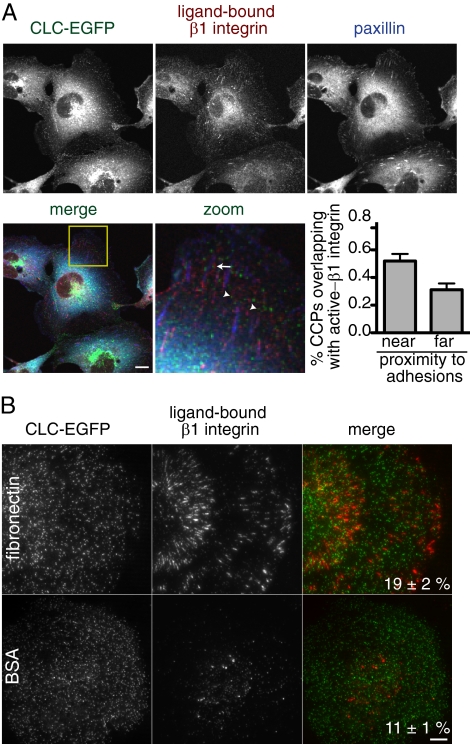
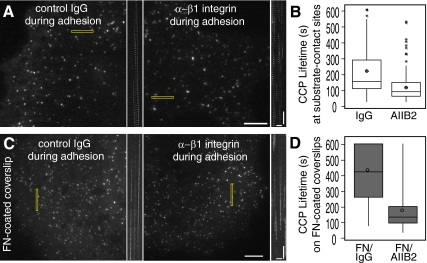
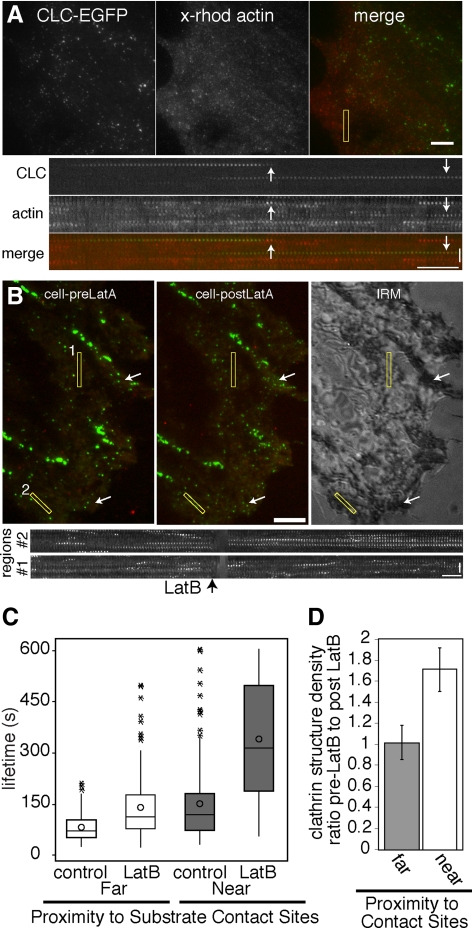
Clathrin-dependent endocytosis is a major route for the cellular import of macromolecules and occurs at the interface between the cell and its surroundings. However, little is known about the influences of cell-substrate attachment in clathrin-coated vesicle formation. Using biochemical and imaging-based methods, we find that cell-substrate adhesion reduces the rate of endocytosis. Clathrin-coated pits (CCPs) in proximity to substrate contacts exhibit slower dynamics in comparison to CCPs found more distant from adhesions. Direct manipulation of the extracellular matrix (ECM) to modulate adhesion demonstrates that tight adhesion dramatically reduces clathrin-dependent endocytosis and extends the lifetimes of clathrin structures. This reduction is in part mediated by integrin-matrix engagement. In addition, we demonstrate that actin cytoskeletal dynamics are differentially required for efficient endocytosis, with a stronger requirement for actin polymerization in areas of adhesion. Together, these results reveal that cell-substrate adhesion regulates clathrin-dependent endocytosis and suggests that actin assembly facilitates vesicle formation at sites of adhesion.


Figures

Figure 1.
Figure 1.
Clathrin dynamics are distinct at sites of substrate adhesion. (A) CLC-EGFP imaged by TIR-FM (left, green in merge) and the ventral cell surface imaged by IRM (center, blue in merge) show that large clathrin structures overlap with substrate contact sites. BSC1 cells were plated in serum-containing medium for 48 h. (B) Bar graph showing mean percentage (±SEM) of large clathrin structures or CCPs adjacent to/overlapping with substrate contact regions, as determined by IRM. n ≥ 399, 21 cells (each clathrin class). (C) Kymograph of representative clathrin structures near and far from substrate contact sites. (D) Box plots showing the distribution of lifetimes of diffraction-limited CCPs, based on their relative proximity to sites of adhesion. n ≥ 283 CCPs, 15 cells/category. Populations were significantly different; p < 0.05, Student's t test. See Supplemental Movie 1. (E) TIR-FM images of CLC-EGFP (left, green in merge) and mCherry-paxillin (center, red in merge). (F) Bar graph showing the mean percentage (±SEM) of large clathrin structures or CCPs adjacent to/overlapping with mCherry-paxillin labeled focal adhesions. n ≥ 404, 20 cells/each clathrin classification. (G) Kymograph of representative clathrin structures based on their relative proximity to mCherry-paxillin-labeled focal adhesions. (H) Box plots showing the distribution of lifetimes of diffraction-limited CCPs based on their relative proximity to mCherry-paxillin–labeled focal adhesions. n ≥100 CCPs, four cells/category. Populations were significantly different; p < 0.001, Student's t test. See Supplemental Movie 2. Scale bars in cells, (A and E) 5 μm. Scale bars in kymographs, time = 1 min and distance = 2 μm.
Figure 2.
Figure 2.
Tightly adhered cells exhibit a reduced rate of endocytosis in comparison to weakly adhered cells. Defined conditions were developed for tight and weak adhesion, shown in (A) an adhesion assay and (B) phase-contrast images of cells plated on fibronectin- and heat-denatured BSA-coated coverslips. Cells are tightly adhered to fibronectin- (□) but poorly attached to BSA (▩)-coated coverslips. Data are shown as mean ± SD, n = three independent experiments. Cells were plated on coated coverslips in serum-free medium for 1- 3 h. (C) Anti-paxillin immunofluorescence TIR-FM images of cells plated on fibronectin- (left) and BSA (right)-coated coverslips are presented, showing the morphology and size of focal adhesions/contacts. Scale bars, 10 μm. (D) Tight adhesion reduces clathrin-dependent endocytosis of transferrin. Time courses of biotin-conjugated transferrin sequestered from avidin in cells plated on fibronectin- (•, dashed line) and BSA (■, solid line)-coated coverslips as in B are shown, demonstrating that clathrin-mediated endocytosis is significantly slowed in cells plated on fibronectin-coated coverslips in comparison to cells plated on BSA-coated coverslips (p < 0.05, Student's t test). Results are shown as a percent of the total surface-associated transferrin. Data are normalized to maximum endocytosis levels and shown as mean ± SD, n = four duplicate experiments.
Figure 3.
Figure 3.
Clathrin-coated structures have increased lifetimes in tightly adhered cells. (A) TIR-FM images and (B) box plots showing CCP lifetime distributions in cells plated on fibronectin- and BSA-coated coverslips for 1–3 h in serum-free medium. Corresponding kymographs made from rectangular regions are shown to right of the images in A. n ≥ 200, five cells each condition. Populations of lifetimes were significantly different, p < 0.05, ANOVA. See Supplemental Movie 3. (C) TIR-FM kymographs of CLC-EGFP (top, green in merge) and dynamin-mRFP (middle, red in merge) from cells plated on BSA-coated coverslips are presented, showing CCPs recruit dynamin late in vesicle formation. See Supplemental Movie 4. (D) Box plots showing the distribution of lifetimes of CCPs based on their relative proximity to mCherry-paxillin-labeled focal adhesions in cells plated on fibronectin-coated coverslips for 1–3 h in serum-free medium. n ≥ 145, four cells. CCP lifetimes near and far from adhesions were significantly different in 3–4 cells, p < 0.05, Student's t test. (E) TIR-FM image and (F) box plots showing CCS lifetime distributions of cells plated on conA- coated coverslips. Cells were incubated for 1–3 h in serum-free medium. Corresponding kymograph made from rectangular region is shown to the right of image. n ≥ 125, four cells each condition. See Supplemental Movie 5. Scale bars in cells, 5 μm. Scale bars in kymographs, time = 1 min and distance = 2 μm.
Figure 4.
Figure 4.
Ligand-bound β1 integrin colocalizes with CCPs at focal adhesions. (A) Indirect immunofluorescence images (imaged by scanning confocal microscopy) of ECM-bound β1 integrin (top center panel, red in merge) and paxillin (top right panel, blue in merge) in BSC1 CLC-EGFP expressing cells plated for 48 h on coverslips in serum-containing medium. CLC-EGFP (top right panel, green in the merge) is also shown. Examples of CCPs overlapping with ECM-bound β1 integrin near (arrow) and far from (arrowheads) focal adhesions are indicated. Bar graph showing the percent (±SEM) of CCPs that overlap with the ECM-bound β1 integrin near and far from focal adhesions is shown (n ≥ 780 CCPs, 14 cells). The fraction of CCPs overlapping with β1 integrin was significantly greater near focal adhesions (p < 0.001, Student's t test). Magnification of yellow-boxed area in merge also shown. (B) Indirect immunofluorescence images (imaged by TIR-FM) of ECM-bound β1 integrin (middle panels, red in merge) in BSC1 CLC-EGFP (left panels, green in merge) cells plated on fibronectin- (top) and BSA (bottom)-coated coverslips. The average percent (±SEM) of CCPs that overlap with the ECM-bound β1 integrin is shown (n ≥ 1100 CCPs, 20 cells/condition) and is significantly different (p < 0.001, Student's t test). Scale bars, 5 μm.
Figure 5.
Figure 5.
β1 integrin–dependent adhesion reduces CCP dynamics. (A and B); TIR-FM images (A) and box plots (B) showing lifetime distributions of CCPs at sites closest to the coverslip in cells plated on “uncoated” coverslips in the presence of either control IgG (left) or inhibitory β1 integrin antibody (AIIB2; right). Cells were incubated for 48 h on the coverslip in serum-free medium. Corresponding kymographs made from the rectangular regions are shown to the right of images. n ≥ 120 CCPs, six cells/condition. Populations of lifetimes were significantly different, p < 0.01, ANOVA. See Supplemental Movie 6. (C) TIR-FM images and (D) box plots showing lifetime distributions of CCPs in cells plated on fibronectin (FN)-coated coverslips and incubated with either control IgG (left) or inhibitory β1 integrin antibody (AIIB2; right) during adhesion. Cells were incubated for 1–3 h in serum-free medium. Corresponding kymographs made from the rectangular regions are shown to right of images. n = 165 CCPs, five cells/condition. Populations of lifetimes were significantly different, p < 0.05, ANOVA. See Supplemental Movie 7. Scale bars in cells, 5 μm. Scale bars in kymographs, 1 min and 2 μm.
Figure 6.
Figure 6.
Actin cytoskeletal assembly is preferentially required for endocytosis at sites of substrate contact. (A) TIR-FM images and kymographs of CLC-EGFP and x-rhodamine actin, showing that actin is recruited to CCPs late during vesicle formation. Cell was plated in serum-containing medium for 48 h. See Supplemental Movie 8. (B) TIR-FM images of CLC-EGFP and dynamin-mRFP and corresponding IRM image showing pattern of adhesion. (C) Box plots showing the lifetime distributions of CCPs that transiently recruit dynamin. Cells plated on uncoated coverslips for 48 h in serum-containing medium were perfused with 1 μM latrunculin B after a 10-min time course. n = 150 CCP/adherent condition per five cells. Significant difference between populations (*p < 0.05, ANOVA). Corresponding kymographs generated from yellow rectangular regions (1 = near contact site; 2 = far from contact site) are shown. (D) Bar graph (mean ± SD) showing the ratio of CCP density before latrunculin B to after latrunculin B treatment in regions near to and far from the substrate (as determined by IRM) is significantly different (p < 0.01, Student's t test). Arrows in C. exemplify regions with increased CCP density after latrunculin B treatment. See Supplemental Movie 9. Scale bars in cells, 5 μm. Scale bars in kymographs, time = 1 min and distance = 2 μm.

Similar articles

Cited by

References

    1. Aggeler J., Werb Z. Initial events during phagocytosis by macrophages viewed from outside and inside the cell: membrane-particle interactions and clathrin. J. Cell Biol. 1982;94:613–623. - PMC - PubMed
    1. Aghamohammadzadeh S., Ayscough K. R. Differential requirements for actin during yeast and mammalian endocytosis. Nat. Cell Biol. 2009;11:1039–1042. - PMC - PubMed
    1. Benesch S., Polo S., Lai F. P., Anderson K. I., Stradal T. E., Wehland J., Rottner K. N-WASP deficiency impairs EGF internalization and actin assembly at clathrin-coated pits. J. Cell Sci. 2005;118:3103–3115. - PubMed
    1. Blanpied T. A., Scott D. B., Ehlers M. D. Dynamics and regulation of clathrin coats at specialized endocytic zones of dendrites and spines. Neuron. 2002;36:435–449. - PubMed
    1. Boucrot E., Saffarian S., Massol R., Kirchhausen T., Ehrlich M. Role of lipids and actin in the formation of clathrin-coated pits. Exp. Cell Res. 2006;312:4036–4048. - PMC - PubMed

Publication types

LinkOut - more resources