Cell adhesion molecules regulate fibrotic process via Th1/Th2/Th17 cell balance in a bleomycin-induced scleroderma model
- PMID: 20624949
- PMCID: PMC3733122
- DOI: 10.4049/jimmunol.0901778
Cell adhesion molecules regulate fibrotic process via Th1/Th2/Th17 cell balance in a bleomycin-induced scleroderma model
Abstract
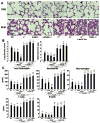
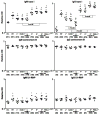
Mice s.c. injected with bleomycin, an experimental model for human systemic sclerosis, develop skin and lung fibrosis, which is mediated by inflammatory cell infiltration. This process is highly regulated by multiple adhesion molecules and does not require Ag sensitization. To assess the role of adhesion molecules in this pathogenetic process, bleomycin-induced fibrosis was examined in mice lacking adhesion molecules. L-selectin and/or ICAM-1 deficiency inhibited skin and lung fibrosis with decreased Th2 and Th17 cytokines and increased Th1 cytokines. In contrast, P-selectin deficiency, E-selectin deficiency with or without P-selectin blockade, or P-selectin glycoprotein ligand 1 (PSGL-1) deficiency augmented the fibrosis in parallel with increased Th2 and Th17 cytokines and decreased Th1 cytokines. Furthermore, loss of L-selectin and/or ICAM-1 reduced Th2 and Th17 cell numbers in bronchoalveolar lavage fluid, whereas loss of P-selectin, E-selectin, or PSGL-1 reduced Th1 cell numbers. Moreover, Th1 cells exhibited higher PSGL-1 expression and lower expression of LFA-1, a ligand for ICAM-1, whereas Th2 and Th17 cells showed higher LFA-1 and lower PSGL-1 expression. This study suggests that L-selectin and ICAM-1 regulate Th2 and Th17 cell accumulation into the skin and lung, leading to the development of fibrosis, and that P-selectin, E-selectin, and PSGL-1 regulate Th1 cell infiltration, resulting in the inhibition of fibrosis.
Conflict of interest statement
Conflict of interest: The authors have declared that no conflict of interest exists.
Figures


Similar articles
-
IL-21 drives skin and lung inflammation and fibrosis in a model for systemic sclerosis.Immunol Lett. 2024 Dec;270:106924. doi: 10.1016/j.imlet.2024.106924. Epub 2024 Sep 12. Immunol Lett. 2024. PMID: 39260526
-
Regulation of local and metastatic host-mediated anti-tumour mechanisms by L-selectin and intercellular adhesion molecule-1.Clin Exp Immunol. 2006 Feb;143(2):216-27. doi: 10.1111/j.1365-2249.2005.02989.x. Clin Exp Immunol. 2006. PMID: 16412045 Free PMC article.
-
GRIM-19-mediated induction of mitochondrial STAT3 alleviates systemic sclerosis by inhibiting fibrosis and Th2/Th17 cells.Exp Mol Med. 2024 Dec;56(12):2739-2746. doi: 10.1038/s12276-024-01366-0. Epub 2024 Dec 6. Exp Mol Med. 2024. PMID: 39643607 Free PMC article.
-
Highly Calibrated Relationship Between Bleomycin Concentrations and Facets of the Active Phase Fibrosis in Classical Mouse Bleomycin Model.Int J Mol Sci. 2024 Nov 15;25(22):12300. doi: 10.3390/ijms252212300. Int J Mol Sci. 2024. PMID: 39596365 Free PMC article.
-
Depressing time: Waiting, melancholia, and the psychoanalytic practice of care.In: Kirtsoglou E, Simpson B, editors. The Time of Anthropology: Studies of Contemporary Chronopolitics. Abingdon: Routledge; 2020. Chapter 5. In: Kirtsoglou E, Simpson B, editors. The Time of Anthropology: Studies of Contemporary Chronopolitics. Abingdon: Routledge; 2020. Chapter 5. PMID: 36137063 Free Books & Documents. Review.
Cited by
-
Chronic graft-versus-host disease: biological insights from preclinical and clinical studies.Blood. 2017 Jan 5;129(1):13-21. doi: 10.1182/blood-2016-06-686618. Epub 2016 Nov 7. Blood. 2017. PMID: 27821504 Free PMC article. Review.
-
E-Selectin, ICAM-1, and ET-1 Biomarkers Address the Concern of the Challenging Diagnosis of Interstitial Lung Disease in Patients with Autoimmune Diseases.Int J Mol Sci. 2023 Aug 7;24(15):12518. doi: 10.3390/ijms241512518. Int J Mol Sci. 2023. PMID: 37569893 Free PMC article.
-
Th17 lymphocytes traffic to the central nervous system independently of α4 integrin expression during EAE.J Exp Med. 2011 Nov 21;208(12):2465-76. doi: 10.1084/jem.20110434. Epub 2011 Oct 24. J Exp Med. 2011. PMID: 22025301 Free PMC article.
-
Targeting PRMT1 prevents acute and chronic graft-versus-host disease.Mol Ther. 2023 Nov 1;31(11):3259-3276. doi: 10.1016/j.ymthe.2023.09.011. Epub 2023 Sep 20. Mol Ther. 2023. PMID: 37735873 Free PMC article.
-
The Pathogenesis of Systemic Sclerosis: An Understanding Based on a Common Pathologic Cascade across Multiple Organs and Additional Organ-Specific Pathologies.J Clin Med. 2020 Aug 19;9(9):2687. doi: 10.3390/jcm9092687. J Clin Med. 2020. PMID: 32825112 Free PMC article. Review.
References
-
- LeRoy EC, Black C, Fleischmajer R, Jablonska S, Krieg T, Medsger TA, Jr, Rowell N, Wollheim F. Scleroderma (systemic sclerosis): Classification, subsets and pathogenesis. J Rheumatol. 1988;15:202–205. - PubMed
-
- Kuwana M, Okano Y, Kaburaki J, Inoko H. Clinical correlation with HLA type in Japanese patients with connective tissue disease and anti-U1 small nuclear RNP antibodies. Arthritis Rheum. 1996;39:938–942. - PubMed
-
- Sato S, Fujimoto M, Hasegawa M, Takehara K. Altered blood B lymphocyte homeostasis in systemic sclerosis: expanded naive B cells and diminished but activated memory B cells. Arthritis Rheum. 2004;50:1918–1927. - PubMed
-
- Tashkin DP, Elashoff R, Clements PJ, Goldin J, Roth MD, Furst DE, Arriola E, Silver R, Strange C, Bolster M, Seibold JR, Riley DJ, Hsu VM, Varga J, Schraufnagel DE, Theodore A, Simms R, Wise R, Wigley F, White B, Steen V, Read C, Mayes M, Parsley E, Mubarak K, Connolly MK, Golden J, Olman M, Fessler B, Rothfield N, Metersky M. Cyclophosphamide versus placebo in scleroderma lung disease. N Engl J Med. 2006;354:2655–2666. - PubMed
-
- Needleman BW, Wigley FM, Stair RW. Interleukin-1, interleukin-2, interleukin-4, interleukin-6, tumor necrosis factor-a, and interferon-g levels in sera from patients with scleroderma. Arthritis Rheum. 1992;35:67–72. - PubMed
Publication types
MeSH terms
Substances
Grants and funding
LinkOut - more resources
Full Text Sources
Other Literature Sources
Medical
Molecular Biology Databases
Miscellaneous

