Magnitude and breadth of a nonprotective neutralizing antibody response in an efficacy trial of a candidate HIV-1 gp120 vaccine
- PMID: 20608874
- PMCID: PMC2946208
- DOI: 10.1086/654816
Magnitude and breadth of a nonprotective neutralizing antibody response in an efficacy trial of a candidate HIV-1 gp120 vaccine
Abstract
Background: A candidate vaccine consisting of human immunodeficiency virus type 1 (HIV-1) subunit gp120 protein was found previously to be nonprotective in an efficacy trial (Vax004) despite strong antibody responses against the vaccine antigens. Here we assessed the magnitude and breadth of neutralizing antibody responses in Vax004.
Methods: Neutralizing antibodies were measured against highly sensitive (tier 1) and moderately sensitive (tier 2) strains of HIV-1 subtype B in 2 independent assays. Vaccine recipients were stratified by sex, race, and high versus low behavioral risk of HIV-1 acquisition.
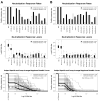
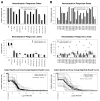
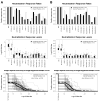
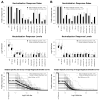
Results: Most vaccine recipients mounted potent neutralizing antibody responses against HIV-1(MN) and other tier 1 viruses. Occasional weak neutralizing activity was detected against tier 2 viruses. The response against tier 1 and tier 2 viruses was significantly stronger in women than in men. Race and behavioral risk of HIV-1 acquisition had no significant effect on the response. Prior vaccination had little effect on the neutralizing antibody response that arose after infection.
Conclusions: Weak overall neutralizing antibody responses against tier 2 viruses is consistent with a lack of protection in this trial. The magnitude and breadth of neutralization reported here should be useful for identifying improved vaccines.
Conflict of interest statement
Potential conflicts of interest: M.Gurwith., F.S., and P.W.B are former employees of VaxGen; P.G. and S.G.S. received consulting fees from VaxGen in the past.
Figures


Similar articles
-
Induction of Heterologous Tier 2 HIV-1-Neutralizing and Cross-Reactive V1/V2-Specific Antibodies in Rabbits by Prime-Boost Immunization.J Virol. 2016 Sep 12;90(19):8644-60. doi: 10.1128/JVI.00853-16. Print 2016 Oct 1. J Virol. 2016. PMID: 27440894 Free PMC article.
-
A Trimeric HIV-1 Envelope gp120 Immunogen Induces Potent and Broad Anti-V1V2 Loop Antibodies against HIV-1 in Rabbits and Rhesus Macaques.J Virol. 2018 Feb 12;92(5):e01796-17. doi: 10.1128/JVI.01796-17. Print 2018 Mar 1. J Virol. 2018. PMID: 29237847 Free PMC article.
-
Effect of HIV Envelope Vaccination on the Subsequent Antibody Response to HIV Infection.mSphere. 2020 Jan 29;5(1):e00738-19. doi: 10.1128/mSphere.00738-19. mSphere. 2020. PMID: 31996422 Free PMC article. Clinical Trial.
-
GP120: target for neutralizing HIV-1 antibodies.Annu Rev Immunol. 2006;24:739-69. doi: 10.1146/annurev.immunol.24.021605.090557. Annu Rev Immunol. 2006. PMID: 16551265 Review.
-
The HIV-1 gp120 V1V2 loop: structure, function and importance for vaccine development.Expert Rev Vaccines. 2014 Dec;13(12):1489-500. doi: 10.1586/14760584.2014.951335. Epub 2014 Aug 28. Expert Rev Vaccines. 2014. PMID: 25163695 Review.
Cited by
-
Natural infection as a blueprint for rational HIV vaccine design.Hum Vaccin Immunother. 2017 Jan 2;13(1):229-236. doi: 10.1080/21645515.2016.1232785. Epub 2016 Sep 20. Hum Vaccin Immunother. 2017. PMID: 27649455 Free PMC article. Review.
-
Co-immunization of DNA and Protein in the Same Anatomical Sites Induces Superior Protective Immune Responses against SHIV Challenge.Cell Rep. 2020 May 12;31(6):107624. doi: 10.1016/j.celrep.2020.107624. Cell Rep. 2020. PMID: 32402293 Free PMC article.
-
The role of neutralizing antibodies in prevention of HIV-1 infection: what can we learn from the mother-to-child transmission context?Retrovirology. 2013 Oct 7;10:103. doi: 10.1186/1742-4690-10-103. Retrovirology. 2013. PMID: 24099103 Free PMC article. Review.
-
HIV vaccinology: 2021 update.Semin Immunol. 2021 Jan;51:101470. doi: 10.1016/j.smim.2021.101470. Epub 2021 Jul 14. Semin Immunol. 2021. PMID: 34272086 Free PMC article. Review.
-
Induction of immunity to human immunodeficiency virus type-1 by vaccination.Immunity. 2010 Oct 29;33(4):542-54. doi: 10.1016/j.immuni.2010.09.011. Immunity. 2010. PMID: 21029964 Free PMC article. Review.
References
-
- Letvin NL. Progress and obstacles in the development of an AIDS vaccine. Nat Rev Immunol. 2006;6:930–9. - PubMed
-
- McMichael AJ. HIV vaccines. Annu Rev Immunol. 2006;24:227–55. - PubMed
-
- Mascola JR, Montefiori DC. The role of antibodies in HIV vaccines. Annu Rev Immunol. 2009 in press. - PubMed
-
- Korber B, Gaschen B, Yusim K, Thakallapally R, Kesmir C, Detours V. Evolutionary and immunological implications of contemporary HIV-1 variation. Br Med Bull. 2001;58:19–42. - PubMed
-
- McCutchan FE. Understanding the genetic diversity of HIV-1. AIDS. 2000;14(Suppl 3):S31–44. - PubMed
Publication types
MeSH terms
Substances
Grants and funding
LinkOut - more resources
Full Text Sources
Other Literature Sources

