. 2010 Oct 1;5(7):601-11.
doi: 10.4161/epi.5.7.12647. Epub 2010 Oct 1.

An S/MAR-based L1 retrotransposition cassette mediates sustained levels of insertional mutagenesis without suffering from epigenetic silencing of DNA methylation

Affiliations

An S/MAR-based L1 retrotransposition cassette mediates sustained levels of insertional mutagenesis without suffering from epigenetic silencing of DNA methylation

Danny Rangasamy. Epigenetics. .

Erratum in

  • Epigenetics. 2011 Jul;6(7):951

Abstract

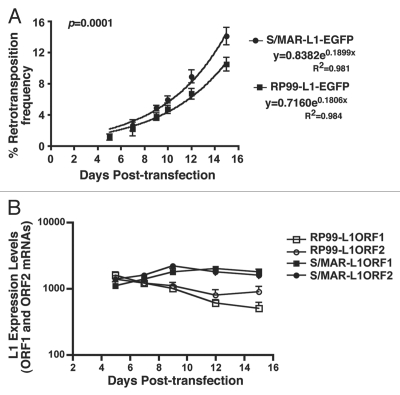
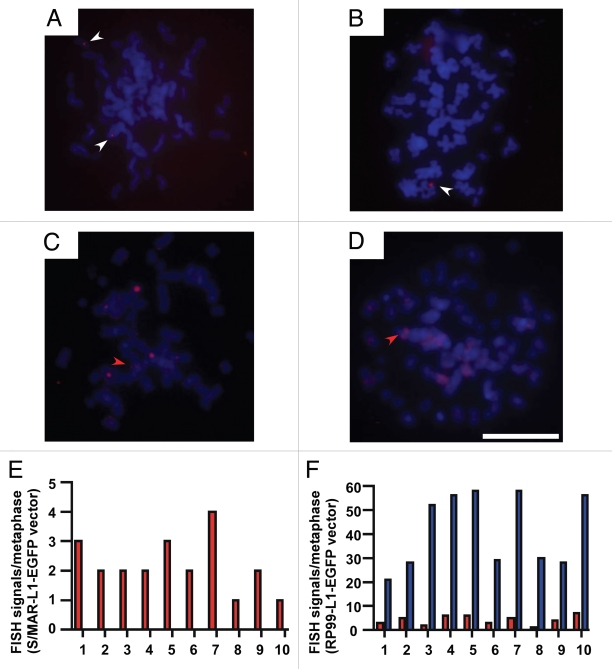
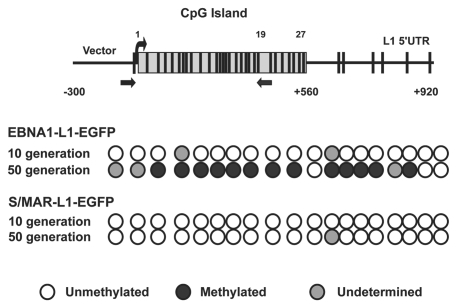
L1 is an insertional mutagen that is capable of mediating permanent gene disruption in mammalian genomes. However, currently available L1 retrotransposition vectors exhibit low or unstable transgene expression when expressed in somatic cells and tissues. This restriction limits their potential utility in long-term screening procedures or somatic mutagenesis applications. In this study, we addressed this problem by developing a minicircle, nonviral L1 retrotransposition vector using a scaffold/matrix attachment region (S/MAR) in the vector backbone and evaluated its utility in human cell lines. The S/MAR-based L1 retrotransposition vector provides stable, elevated levels of L1 expression compared to the currently used EBNA1-based L1 vector. In addition, the S/MAR elements effectively mediate sustained levels of L1 retrotransposition in prolonged cell culturing without suffering from epigenetic silencing by DNA methylation or from vector integration problems even in the absence of selection pressure. These findings indicate that the simple inclusion of S/MAR in the vector backbone increased levels of L1 expression and retrotransposition that can be used as an effective tool to generate insertional mutagenesis in large-scale somatic mutagenesis applications in mammalian cells.


Figures

Figure 1
Figure 1
Design of the L1 retrotransposition cassette for somatic mutagenesis. (A) Schematic diagrams of L1-EGFP expression cassettes used for L1 retrotransposition assays in cultured human cells. The left part shows the newly designed S/MAR-based L1 episomal system. pS/MAR-L1-EGFP encoding resistance to geneticin (G418) and S/MAR sequence fused with luciferase reporter (LUC). The right part shows the currently available EBNA1-based L1 episomal system. pRP99-L1-EGFP encoding resistance to hygromycin (Hygro) and EBNA1 for replication in mammalian cells. In both expression systems, L1 transcription is driven by its own 5′UTR, which harbors an internal promoter. The L1 retrotransposon contains an intron-interrupted EGFP reporter in the 3′UTR region with its own CMV promoter and polyadenylation signal (pA). The EGFP indicator cassette is in the antisense orientation relative to L1. Only when EGFP is transcribed from the L1 promoter, spliced, reverse transcribed and integrated into the genome does a cell become GFP-positive. As a negative control, inactive L1 (pS/MAR-muL1-EGFP or pRP99-muL1-EGFP) containing two missense mutations in ORF1 was used. Arrows depict the location of the geno-5 (left) and geno-3 (right) primers used in the PC R assay shown below. SD, splice donor; SA, splice acceptor. (B) Detection of L1 retrotransposition events in cultured human cells. The geno-5 and geno-3 primers that flank the intron in EGFP were used for PCR amplification of genomic DNA and products were analyzed on a 1.2% agarose gel. PCR products of 1.49 kb (corresponding to the intron-containing transgene) and 530 bp (corresponding to the retrotransposed insertion that lacks the 909 bp intron) are shown. Negative, genomic DNA from untransfected cells; Vector, 1 ng plasmid DNA; Marker, 1 kb-plus DNA marker (Invitrogen). As a negative control for retrotransposition, inactive L1 (pS/MAR-muL1-EGFP and pRP99-muL1-EGFP) vectors were used. (C) Quantitative real-time RT-PC R analysis of L1 transcripts was conducted in control cells (transfected with retrotransposition-defective vector) or pRP99-L1-EGFP and pS/MAR-L1-EGFP-transfected cells 72 h post-transfection. The data are shown as relative fold change of L1 ORF1 and L1 ORF2 mRNA levels compared to control cells after normalizing to the housekeeping gene HPRT1. The levels of mRNA expression in control cells was set to 1. Each point represents the averages of three independent experiments. *p = 0.001. Error bars show s.d. (n = 3).
Figure 2
Figure 2
The S/MAR-based L1 system mediates high and sustained retrotransposition frequency. (A) Percentage of EGFP fluorescent cells from a stable population was plotted over time for pS/MAR-L1-EGFP and pRP99-L1-EGFP transfected cells. Each time point represents cell populations from three independent transfections. Sampling and analysis were performed at 5, 7, 9, 10, 12 and 15 days after plating of stably transfected cells. The retrotransposition rates were estimated from the slope of a line created by linear regression. The error bars indicate s.d. (n = 3). (B) The expression levels of L1 transcripts in a stable population of cells as shown in the top part. The absolute expression levels of L1 ORF1 and L1 ORF2 mRNAs was determined by quantitative real-time PCR using a plasmid DNA standard curve. The mean copy numbers of ORF1 and ORF2 are plotted on the y-axis with error bars representing standard error of three assays. One-way analysis of variance, p = 0.007. (C) Equal numbers of HEK293 cells (1 × 10³ cells) stably transfected with either pS/MAR-L1-EGFP or pRP99-L1-EGFP were cultured in the presence (+) or the absence (−) of selective antibiotics for 50 days. The mean percentage EGFP-expressing cells remaining at various time points are shown for each group after assessing L1 retrotransposition by flow cytometry. One-way analysis of variance, p < 0.0001. Error bars show s.d. (n = 3).
Figure 3
Figure 3
FISH analysis of the L1 episomes on metaphase chromosomes. Metaphase spreads from HEK293 cells containing pS/MAR-L1-EGFP vector (A and B) were probed with an S/MAR-specific probe after 10 and 50 cell generations, respectively. FISH analysis of cells transfected with pRP99-L1-EGFP and probed with an EBNA-1-specific sequence after 10 and 50 cell generations are shown in (C and D), respectively. Nuclei were stained with DAPI (blue) and FISH probes (red). The colored and white arrows on metaphase chromosomal spreads indicate the integrated vectors as close double labels on sister chromatids and episomal vectors as individual hybridization signals. Scale bar represents 10 µm. (E and F) Quantification of the number of FISH signals per nucleus in HEK293 cells stably transfected with pS/MAR-L1-EGFP or pRP99-L1-EGFP vectors and grown for 50 cell generations in the presence of selective antibiotics. Individual FISH signals on metaphase spreads from 10 different transformed cells were analyzed for each construct and counted under fluorescence microscopy. The mean number of episomal (red column) or the integrated (blue column) vectors are shown for each construct.
Figure 4
Figure 4
DNA methylation analysis. Schematic representation of CpG sites distribution within 5′UTR of the L1 promoter from +1 to +920 bp (relative to the transcription start site) in the adjacent 5′-vector region. Vertical lines above indicate the position and numbering of CpG dinucleotides; the box represents the CpG island in the L1 promoter (ending at +560 bp). Primers used for bisulfite sequencing are indicated by arrows. We analyzed the methylation status of 19 CpG sites (1–19) within the CpG island by bisulfite sequencing. The corresponding methylation of these CpG sites is illustrated below. Circles represent CpG sites and the methylation status for each construct is shown by row as displayed by BiQ-Analyzer. Solid black circles indicate the presence of DNA methylation while white circles indicate the absence of DNA methylation.

Similar articles

Cited by

References

    1. An W, Boeke JD. Transposon technology and vertebrate functional genomics. Genome Biol. 2005;6:361. - PMC - PubMed
    1. Babushok DV, Ostertag EM, Courtney CE, Choi JM, Kazazian HH., Jr L1 integration in a transgenic mouse model. Genome Res. 2006;16:1–3. - PMC - PubMed
    1. Ostertag EM, Madison BB, Kano H. Mutagenesis in rodents using the L1 retrotransposon. Genome Biol. 2007;8:16. - PMC - PubMed
    1. An W, Han JS, Wheelan SJ, Davis ES, Coombes CE, Ye P, et al. Active retrotransposition by a synthetic L1 element in mice. Proc Nat Acad Sci USA. 2006;103:18662–18667. - PMC - PubMed
    1. Collier LS, Largaespada DA. Transposons for cancer gene discovery: Sleeping Beauty and beyond. Genome Biol. 2007;8:15. - PMC - PubMed

Publication types

Substances

LinkOut - more resources