. 2010 Aug 15;21(16):2894-904.
doi: 10.1091/mbc.E10-02-0157. Epub 2010 Jun 29.

Quantitative analysis of the mechanism of endocytic actin patch assembly and disassembly in fission yeast

Affiliations

Quantitative analysis of the mechanism of endocytic actin patch assembly and disassembly in fission yeast

Vladimir Sirotkin et al. Mol Biol Cell. .

Abstract

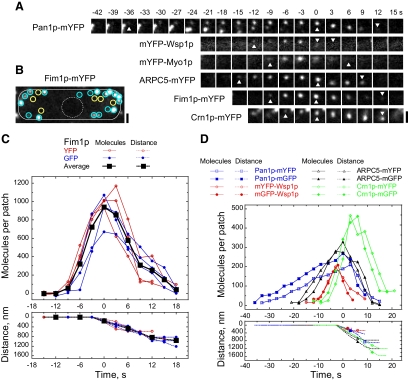
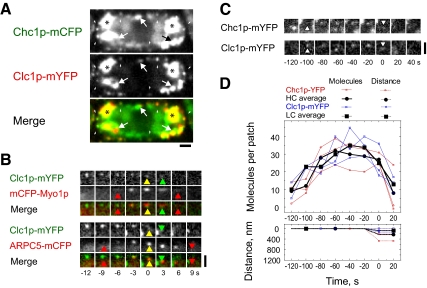
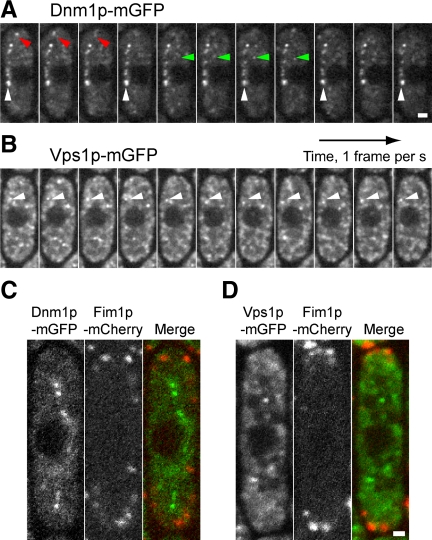
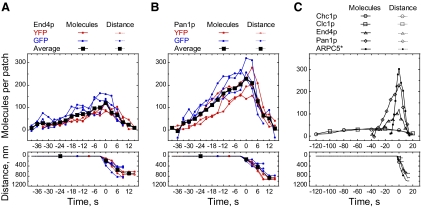
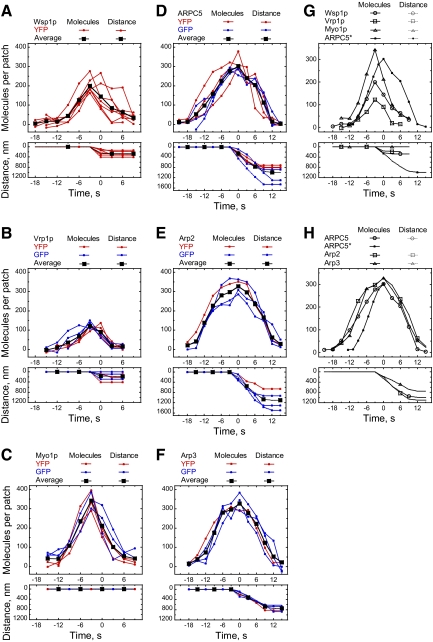
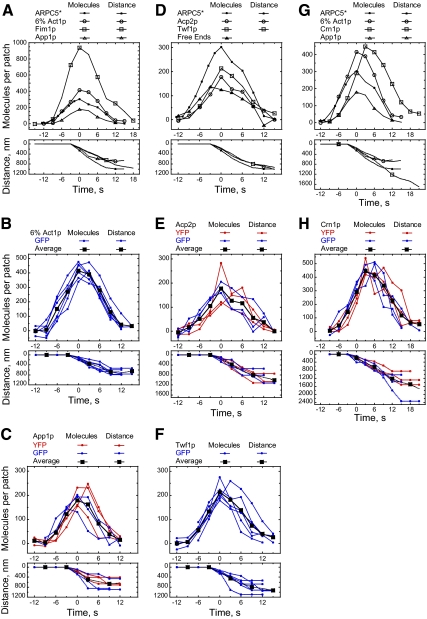
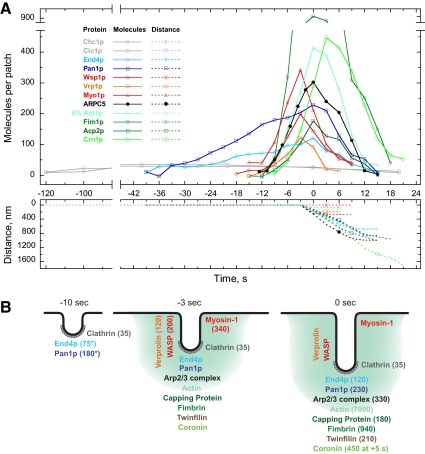
We used quantitative confocal microscopy to measure the numbers of 16 proteins tagged with fluorescent proteins during assembly and disassembly of endocytic actin patches in fission yeast. The peak numbers of each molecule that accumulate in patches varied <30-50% between individual patches. The pathway begins with accumulation of 30-40 clathrin molecules, sufficient to build a hemisphere at the tip of a plasma membrane invagination. Thereafter precisely timed waves of proteins reach characteristic peak numbers: endocytic adaptor proteins (approximately 120 End4p and approximately 230 Pan1p), activators of Arp2/3 complex (approximately 200 Wsp1p and approximately 340 Myo1p) and approximately 300 Arp2/3 complexes just ahead of a burst of actin assembly into short, capped and highly cross-linked filaments (approximately 7000 actins, approximately 200 capping proteins, and approximately 900 fimbrins). Coronin arrives last as all other components disperse upon patch internalization and movement over approximately 10 s. Patch internalization occurs without recruitment of dynamins. Mathematical modeling, described in the accompanying paper (Berro et al., 2010, MBoC 21: 2803-2813), shows that the dendritic nucleation hypothesis can account for the time course of actin assembly into a branched network of several hundred filaments 100-200 nm long and that patch disassembly requires actin filament fragmentation in addition to depolymerization from the ends.


Figures

Figure 1.
Figure 1.
Time courses of protein accumulation and loss in endocytic patches. (A) Time series of micrographs showing the accumulation and loss of YFP-labeled Pan1p, Wsp1p, Myo1p, ARPC5, Fim1p, and Crn1p in individual patches. Confocal fluorescence images through the middle of cells were collected every 3 s. Arrowheads mark the appearance, movement (except for Myo1p) and disappearance of each component. (B) A micrograph of a single confocal section through the middle of a cell expressing Fim1p-mYFP showing areas selected as patches (blue circles) and cytoplasmic background (yellow circles). Solid white line shows cell outline, and dashed white line outlines the nucleus. Scale bars, 1 μm. (C) Comparison and averaging of raw time courses for the number of molecules of YFP-labeled (red, ○) and GFP-labeled (blue, ●) fimbrin Fim1p in individual patches. Averaged time courses (black, ■) were produced by aligning individual time courses to time 0, when patch initiated movement, and averaging at each time point the molecules per patch (top panel, solid lines) and distances traveled by patches (bottom panel, dashed lines). (D) Comparison of average time courses obtained with YFP-labeled proteins (open symbols) and GFP-labeled proteins (closed symbols). Solid lines in the top panel are the average number of molecules per patch, and dashed lines in the bottom panel are distances traveled for Pan1p (blue squares), Wsp1p (red circles), ARPC5 (black triangles), and Crn1p (green diamonds) associated with patches. Each time course is an average of data from three to seven patches. In C and D the numbers of GFP-labeled proteins were calculated from time-lapse movies of Z-sections through entire cells, and the numbers of YFP-labeled proteins were calculated from time-lapse movies in single sections through the middle of cells.
Figure 2.
Figure 2.
Time course of clathrin accumulation and loss in endocytic actin patches in spinning disk confocal fluorescence micrographs. (A) Images through the midsection of a cell showing Chc1p-mCFP (green) and Clc1p-mYFP (red) in two types of structures: dim peripheral patches (arrowheads) and bright intracellular globular structures (arrows and asterisks) of two different sizes. (B) Images through the midsection of cells showing one-to-one transitions of patches marked with clathrin (Clc1p-mYFP top rows, green in merge) into patches marked with Myo1p or Arp2/3 complex (mCFP-Myo1p or ARPC5-mCFP, middle rows, red in merge). Green arrowheads mark the last frames where Clc1p is present, red arrowheads mark the first and last frames where Myo1p and Arp2/3 complex were present, and yellow arrowhead marks initiation of patch movement. (C) Images through the midsections of cells showing individual patches marked with Chc1p-mYFP or Clc1p-mYFP. Note that clathrin moved in the last frame where the patch was present (arrowhead). (D) Raw and average time courses for YFP-labeled clathrin heavy-chain Chc1p and clathrin light-chain Clc1p. Raw time courses for three Chc1p-mYFP (red, ○) and three Clc1p-mYFP (blue, □) patches were aligned to the time of disappearance of clathrin at +20 s and averaged to produce time courses for the average numbers of clathrin heavy chains (black, ●) and clathrin light chains (black, ■) per patch (top panels, solid lines) and distances traveled by clathrin associated with patches (bottom panels, dashed lines).
Figure 3.
Figure 3.
Localization and dynamics of mGFP-tagged dynamin-like proteins in fission yeast. (A and B) Time series of spinning disk confocal fluorescence micrographs acquired every second through the middle of cells expressing (A) Dnm1p-mGFP and (B) Vps1p-mGFP. Dynamin Dnm1p concentrates in punctate structures that form linear arrays (white arrowheads) or move in/out of focus (green/red arrowheads). Vps1p is detected in reticulate meshwork throughout the cytoplasm and in small motile dots (arrowheads). (C and D) Comparison of localization of dynamin-like proteins with actin patch marker fimbrin Fim1p in single confocal sections through the middle of the cells expressing (C) Dnm1p-mGFP (green in merge) and Fim1p-mCherry (red in merge) or (D) Vps1p-mGFP (green in merge) and Fim1p-mCherry (red in merge). Note the complete lack of colocalization. Scale bars, 1 μm.
Figure 4.
Figure 4.
Time courses of the concentrations of endocytic adaptor proteins End4p and Pan1p in endocytic patches. (A and B) Raw and average time courses of the number of molecules per patch (top panels, solid lines) and distances traveled by markers associated with patches (bottom panels, dashed lines). (A) End4p. (B) Pan1p. Time courses for YFP-labeled (red, ○) and GFP-labeled (blue, ●) proteins in individual patches were aligned to initiation of patch movement at time 0 and averaged at each time point to produce averaged time courses (black, ■). Numbers of GFP-labeled proteins were calculated from time-lapse movies of Z-sections through entire cells. Numbers of YFP-labeled proteins were calculated from time-lapse movies in single sections through the middle of cells. Averages include data from three YFP-labeled and three GFP-labeled patches. (C) Comparison of average time courses for (○) clathrin heavy-chain Chc1p, (□) clathrin light-chain Clc1p, (△) End4p, (◊) Pan1p, and (●) ARPC5 subunit of Arp2/3 complex. Time courses were aligned to the initiation of patch movement (time 0). The Arp2/3 complex time course was corrected (*) to match the timing of patch assembly of fimbrin.
Figure 5.
Figure 5.
Time courses of the concentrations of Arp2/3 complex activators Wsp1p, Vrp1p, and Myo1p and Arp2/3 complex subunits ARPC5, Arp2, and Arp3 in endocytic patches. (A–F) Raw and average time courses of the number of molecules per patch (top panels, solid lines) and distances traveled by markers associated with patches (bottom panels, dashed lines). (A) WASp Wsp1p. (B) Verprolin Vrp1p. (C) Myosin-1 Myo1p. (D) ARPC5. (E) Arp2. (F) Arp3. Time courses for YFP-labeled (red, ○) and GFP-labeled (blue, •) proteins in individual patches were aligned and averaged at each time point to produce averaged time courses (black, ■). Time courses were aligned to initiation of patch movement at time 0, except for the time courses for Myo1p, which were aligned to peak values. Numbers of GFP-labeled proteins were calculated from time-lapse movies of Z-sections through entire cells. Numbers of YFP-labeled proteins were calculated from time-lapse movies in single sections through the middle of cells. Averages include data from seven YFP-labeled patches for Wsp1p, and one YFP- and three GFP-labeled patches for Arp2 and Arp3, and three YFP- and three GFP-labeled patches for all others. (G and H) Comparison of average time courses for Arp2/3 complex activators and subunits of Arp2/3 complex. (G) Average time courses for (○) Wsp1p, (□) Vrp1p, (▵) Myo1p, and (•) ARPC5 subunit of Arp2/3 complex. (H) Average time courses for (○) ARPC5, (□) Arp2, (▵) Arp3 subunits of Arp2/3 complex and (•) adjusted time course for the ARPC5 subunit. Time courses were aligned to the initiation of patch movement (time 0), and peak of Myo1p time course was aligned to the time of Wsp1p peak. Asterisk (*) indicates that the (•) ARPC5* time course was corrected to match the timing of assembly of fimbrin into patches.
Figure 6.
Figure 6.
Time courses of the concentrations of actin and actin-binding proteins in endocytic patches. Comparison of raw and average time courses of the number of molecules per patch (solid lines, top panels) and distance traveled by patches (dashed lines, bottom panels) for Arp2/3 complex, actin and actin-binding proteins. (A–C) Time courses for actin Act1p, fimbrin Fim1p, and App1p. (A) Comparison of average time courses for (○) mGFP-Act1p estimated to represent 6% of total actin, (□) fimbrin Fim1p, and (▵) App1p versus (•) ARPC5* time course that was corrected to match the timing of assembly of fimbrin into patches. (B and C) Raw and average time courses. (B) mGFP-Act1p. (C) App1p. (D–F) Time courses for actin-capping protein Acp2p and twinfilin Twf1p. (D) Comparison of (•) adjusted average ARPC5* time course with average time courses for (○) capping protein Acp2p, (□) twinfilin Twf1p, and (▴) the maximum number of growing barbed actin filament ends. The maximum number of growing ends is the difference between the number of ARPC5 and Acp2p molecules. (E and F) Raw and average time courses. (E) Acp2p. (F) Twf1p. (G and H) Time courses for coronin Crn1p. (G) Comparison of (•) adjusted average ARPC5* time course with average time courses for (○) mGFP-Act1p estimated to represent 6% of total actin, (□) coronin Crn1p, and (▵) Abp1p homolog App1p. Note that Crn1p appears and peaks 3–5 s after the other proteins. (H) Raw and average time courses for Crn1p. In B, C, E, F, and H, raw time courses for YFP-labeled (red, ○) and GFP-labeled proteins (blue, •) in individual patches were aligned to the time of initiation of patch movement at time 0 and the molecules per patch (top panels, solid lines) and distance (bottom panels, dashed line) traveled by markers associated with patches were averaged at each time point to produce average time courses (black, ■). Numbers of GFP-labeled proteins were calculated from time-lapse movies of Z-sections through entire cells. Numbers of YFP-labeled proteins were calculated from time-lapse movies in single sections through the middle of cells. Averages include data from six GFP-labeled patches for Act1p and Twf1p, and three YFP- and three GFP-labeled patches for all others.
Figure 7.
Figure 7.
Summary time course of the assembly and disassembly of actin patch proteins at the site of endocytosis. (A) Summary time course of the number of molecules (solid lines) and distance traveled (dashed lines) of 12 endocytic actin patch components. Each time course is an average of data for three YFP-labeled patches for clathrin, seven YFP-labeled patches for Wsp1p, six GFP-labeled patches for Act1p, and three YFP- and three GFP-labeled patches for all other components. Numbers of GFP-labeled proteins were calculated from time-lapse 3D image series and numbers of YFP-labeled proteins were calculated from time-lapse series in one confocal section. All time courses were aligned to time 0, which marks initiation of patch movement, except for Myo1p, which was aligned with the Wsp1p peak. The ARPC5 time course was corrected so that the timing of patch assembly matched that of fimbrin. mGFP-Act1p is estimated to represent 6% of total actin. (B) Schematic diagram illustrating counts of proteins associated with an actin patch at the site of endocytic invagination at times −10, −3, and 0 s. Colors of fonts correspond to the colors in A. Numbers in parenthesis indicate the peak numbers of each protein, except for End4p and Pan1p at −10 s (asterisks). All of the proteins listed below Arp2/3 complex are presumed to be distributed throughout the actin network (shaded teal). The approximate positions of other proteins are adapted from Idrissi et al. (2008).

Similar articles

Cited by

References

    1. Bahler J., Wu J. Q., Longtine M. S., Shah N. G., McKenzie A., 3rd, Steever A. B., Wach A., Philippsen P., Pringle J. R. Heterologous modules for efficient and versatile PCR-based gene targeting in Schizosaccharomyces pombe. Yeast. 1998;14:943–951. - PubMed
    1. Berro J., Sirotkin V., Pollard T. D. Mathematical modeling of endocytic actin patch kinetics in fission yeast: disassembly requires release of actin filament fragments. Mol. Biol. Cell. 2010;21:2905–2915. - PMC - PubMed
    1. Brieher W. M., Kueh H. Y., Ballif B. A., Mitchison T. J. Rapid actin monomer-insensitive depolymerization of Listeria actin comet tails by cofilin, coronin, and Aip1. J. Cell Biol. 2006;175:315–324. - PMC - PubMed
    1. Ferguson S. M., et al. Coordinated actions of actin and BAR proteins upstream of dynamin at endocytic clathrin-coated pits. Dev. Cell. 2009;17:811–822. - PMC - PubMed
    1. Fotin A., Cheng Y., Sliz P., Grigorieff N., Harrison S. C., Kirchhausen T., Walz T. Molecular model for a complete clathrin lattice from electron cryomicroscopy. Nature. 2004;432:573–579. - PubMed

Publication types

MeSH terms

LinkOut - more resources