The cell-specific induction of CXC chemokine ligand 9 mediated by IFN-gamma in microglia of the central nervous system is determined by the myeloid transcription factor PU.1
- PMID: 20585034
- PMCID: PMC2925661
- DOI: 10.4049/jimmunol.1000900
The cell-specific induction of CXC chemokine ligand 9 mediated by IFN-gamma in microglia of the central nervous system is determined by the myeloid transcription factor PU.1
Abstract
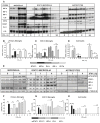
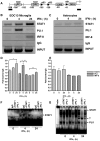
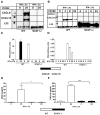
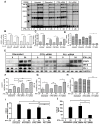
The IFN-gamma-inducible chemokines CXCL9 and CXCL10 are implicated in the pathogenesis of T cell-mediated immunity in the CNS. However, in various CNS immune pathologies the cellular localization of these chemokines differs, with CXCL9 produced by macrophage/microglia whereas CXCL10 is produced by both macrophage/microglia and astrocytes. In this study, we determined the mechanism for the microglial cell-restricted expression of the Cxcl9 gene induced by IFN-gamma. In cultured glial cells, the induction of the CXCL9 (in microglia) and CXCL10 (in microglia and astrocytes) mRNAs by IFN-gamma was not inhibited by cycloheximide. Of various transcription factors involved with IFN-gamma-mediated gene regulation, PU.1 was identified as a constitutively expressed NF in microglia but not in astrocytes. STAT1 and PU.1 bound constitutively to the Cxcl9 gene promoter in microglia, and this increased significantly following IFN-gamma treatment with IFN regulatory factor-8 identified as an additional late binding factor. However, in astrocytes, STAT1 alone bound to the Cxcl9 gene promoter. STAT1 was critical for IFN-gamma induction of both the Cxcl9 and Cxcl10 genes in microglia and in microglia and astrocytes, respectively. The small interfering RNA-mediated knockdown of PU.1 in microglia markedly impaired IFN-gamma-induced CXCL9 but not STAT1 or IFN regulatory factor-8. Cells of the D1A astrocyte line showed partial reprogramming to a myeloid-like phenotype posttransduction with PU.1 and, in addition to the expression of CD11b, acquired the ability to produce CXCL9 in response to IFN-gamma. Thus, PU.1 not only is crucial for the induction of CXCL9 by IFN-gamma in microglia but also is a key determinant factor for the cell-specific expression of this chemokine by these myeloid cells.
Figures


Similar articles
-
Induction of the genes for Cxcl9 and Cxcl10 is dependent on IFN-gamma but shows differential cellular expression in experimental autoimmune encephalomyelitis and by astrocytes and microglia in vitro.Glia. 2007 Dec;55(16):1728-39. doi: 10.1002/glia.20587. Glia. 2007. PMID: 17902170
-
Interferon-independent, human immunodeficiency virus type 1 gp120-mediated induction of CXCL10/IP-10 gene expression by astrocytes in vivo and in vitro.J Virol. 2001 Aug;75(15):7067-77. doi: 10.1128/JVI.75.15.7067-7077.2001. J Virol. 2001. PMID: 11435587 Free PMC article.
-
Inhibition of interferon (IFN) gamma-induced Jak-STAT1 activation in microglia by vasoactive intestinal peptide: inhibitory effect on CD40, IFN-induced protein-10, and inducible nitric-oxide synthase expression.J Biol Chem. 2003 Jul 25;278(30):27620-9. doi: 10.1074/jbc.M303199200. Epub 2003 May 15. J Biol Chem. 2003. PMID: 12754213
-
CXCL9, CXCL10, CXCL11, and their receptor (CXCR3) in neuroinflammation and neurodegeneration.Adv Clin Exp Med. 2018 Jun;27(6):849-856. doi: 10.17219/acem/68846. Adv Clin Exp Med. 2018. PMID: 29893515 Review.
-
Microglia-driven regulation of oligodendrocyte lineage cells, myelination, and remyelination.J Leukoc Biol. 2017 May;101(5):1103-1108. doi: 10.1189/jlb.3RI1116-494R. Epub 2017 Mar 1. J Leukoc Biol. 2017. PMID: 28250011 Review.
Cited by
-
Adipocyte-Specific Ablation of PU.1 Promotes Energy Expenditure and Ameliorates Metabolic Syndrome in Aging Mice.Front Aging. 2022 Feb 2;2:803482. doi: 10.3389/fragi.2021.803482. eCollection 2021. Front Aging. 2022. PMID: 35822007 Free PMC article.
-
CXCL9: evidence and contradictions for its role in tumor progression.Cancer Med. 2016 Nov;5(11):3246-3259. doi: 10.1002/cam4.934. Epub 2016 Oct 10. Cancer Med. 2016. PMID: 27726306 Free PMC article. Review.
-
MORA and EnsembleTFpredictor: An ensemble approach to reveal functional transcription factor regulatory networks.PLoS One. 2023 Nov 30;18(11):e0294724. doi: 10.1371/journal.pone.0294724. eCollection 2023. PLoS One. 2023. PMID: 38032891 Free PMC article.
-
Functional genomics reveals an essential and specific role for Stat1 in protection of the central nervous system following herpes simplex virus corneal infection.J Virol. 2011 Dec;85(24):12972-81. doi: 10.1128/JVI.06032-11. Epub 2011 Oct 12. J Virol. 2011. PMID: 21994441 Free PMC article.
-
Lymphocyte networks are dynamic cellular communities in the immunoregulatory landscape of lung adenocarcinoma.Cancer Cell. 2023 May 8;41(5):871-886.e10. doi: 10.1016/j.ccell.2023.03.015. Epub 2023 Apr 13. Cancer Cell. 2023. PMID: 37059105 Free PMC article.
References
-
- Luster AD, Unkeless JC, Ravetch JV. γ-interferon transcriptionally regulates an early-response gene containing homology to platelet proteins. Nature. 1985;315:672–676. - PubMed
-
- Vanguri P, Farber JM. Identification of CRG-2. An interferon-inducible mRNA predicted to encode a murine monokine. J Biol Chem. 1990;265:15049–15057. - PubMed
-
- Cole KE, Strick CA, Paradis TJ, Ogborne KT, Loetscher M, Gladue RP, Lin W, Boyd JG, Moser B, Wood DE, Sahagan BG, Neote K. Interferon-inducible T cell alpha chemoattractant (I-TAC): a novel non-ELR CXC chemokine with potent activity on activated T cells through selective high affinity binding to CXCR3. J Exp Med. 1998;187:2009–2021. - PMC - PubMed
-
- Rani MRS, Foster GR, Leung S, Leaman D, Stark GR, Ransohoff RM. Characterization of β-R1, a gene that is selectively induced by interferon β (IFN-β) compared with IFN-α. J Biol Chem. 1996;271:22878–22884. - PubMed
Publication types
MeSH terms
Substances
Grants and funding
LinkOut - more resources
Full Text Sources
Other Literature Sources
Molecular Biology Databases
Research Materials
Miscellaneous

