. 2010 Sep;299(3):C672-81.
doi: 10.1152/ajpcell.00451.2009. Epub 2010 Jun 16.

Novel anti-adipogenic activity produced by human fibroblasts

Affiliations

Novel anti-adipogenic activity produced by human fibroblasts

Geniece M Lehmann et al. Am J Physiol Cell Physiol. 2010 Sep.

Abstract

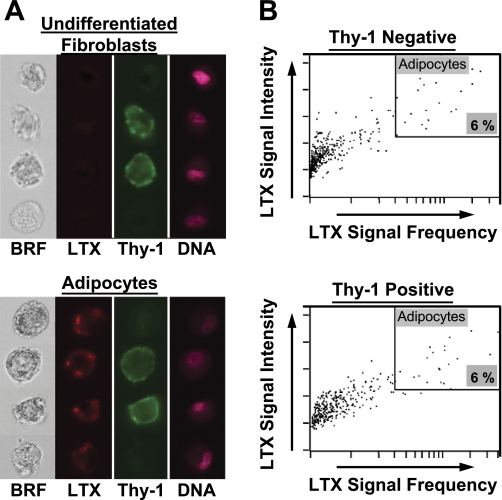
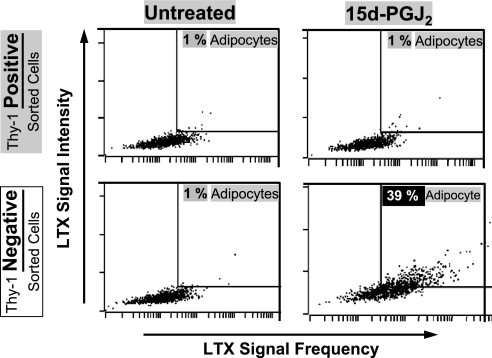
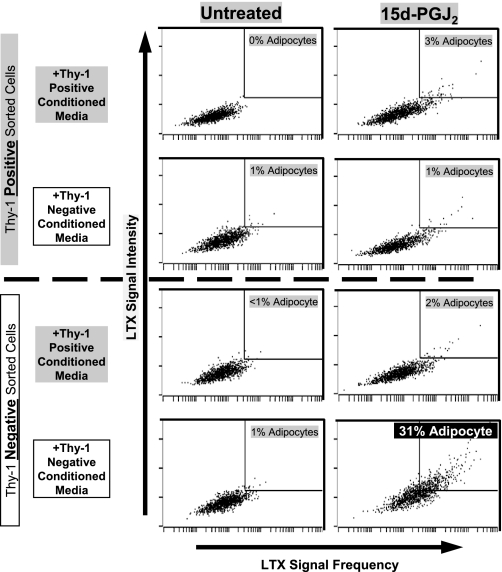
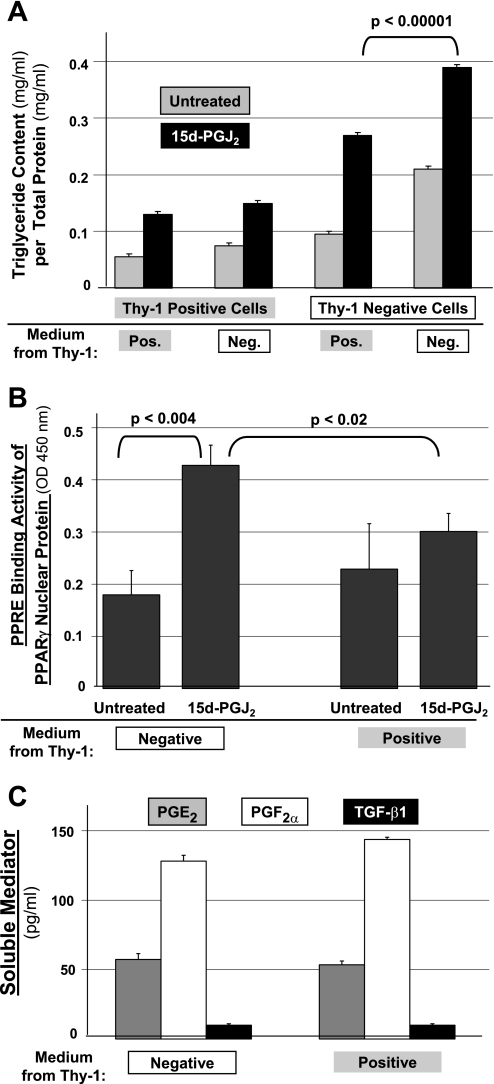
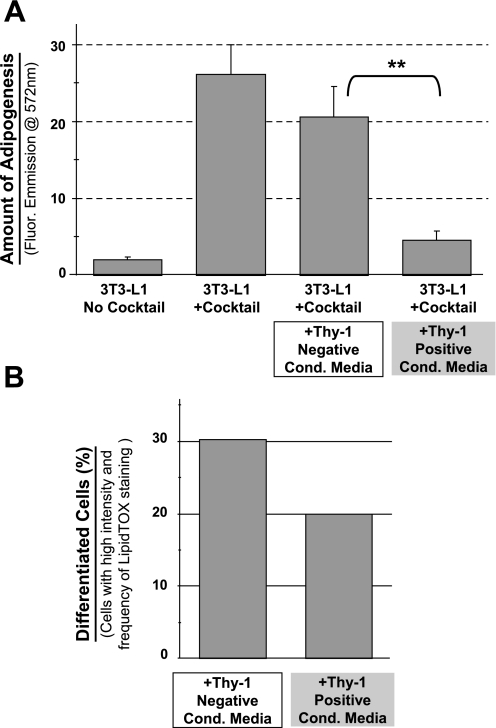
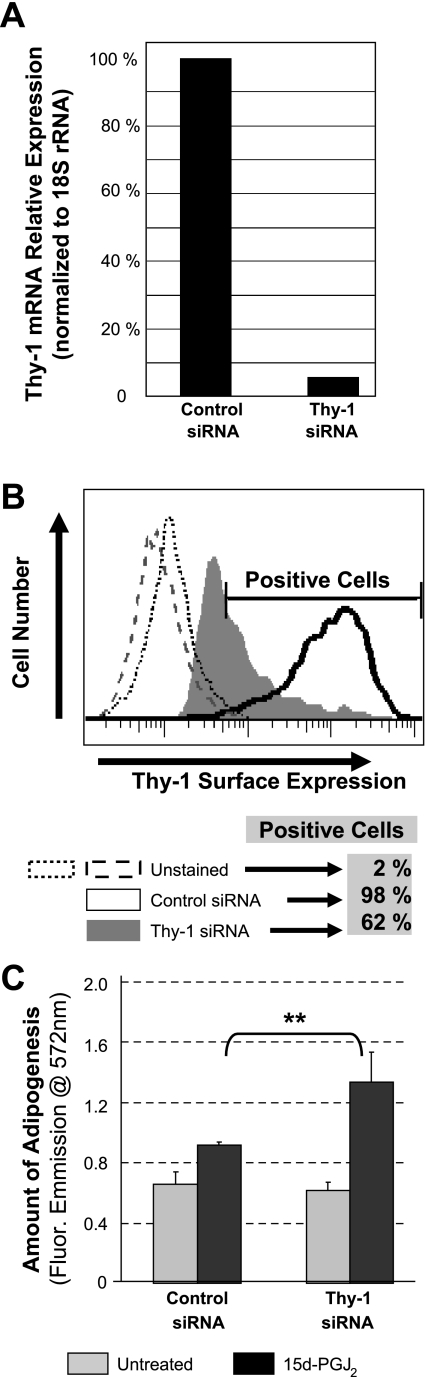
Fatty tissue is generally found in distinct "depots" distributed throughout the human body. Adipocytes from each of the various depots differ in their metabolic capacities and their responses to environmental stimuli. Although a general understanding of the factors responsible for adipogenic transformation has been achieved, much is not understood about the mechanisms of adipose tissue deposition and the phenotypes of the adipocytes found within each depot. A clue to the factors regulating fat deposition may come from studies of adipogenesis using primary human orbital fibroblasts from patients with thyroid eye disease, a condition in which intense inflammation leads to expansion of orbital adipose tissue via differentiation of fibroblasts to adipocytes. We have previously demonstrated that adipogenesis of orbital fibroblasts is negatively correlated with cellular expression of the Thy-1 surface marker. In this study, we developed a novel imaging flow cytometric approach for the assessment of adipogenesis to test the hypothetical dependence of adipogenic potential on lack of Thy-1 expression. Using this technique, we learned that Thy-1-positive fibroblasts are, in fact, capable of differentiating into adipocytes but are less likely to do so because they secrete a paracrine anti-adipogenic factor. It is possible that such a factor plays an important role in the prevention of excess fat deposition in the normal orbit and may even be exploited as a therapy for the treatment of obesity, a major worldwide health concern.


Figures

Fig. 1.
Fig. 1.
ImageStream analysis demonstrates that, when cultured together, Thy-1-positive and Thy-1-negative primary human orbital fibroblasts are equally disposed to adipogenic differentiation. Human orbital fibroblasts were differentiated as described in materials and methods. They were then stained for Thy-1 using a monoclonal Thy-1 antibody and for the accumulation of neutral lipids into droplets using LipidTOX (LTX). An Amnis ImageStream imaging flow cytometer was used to visualize cells (A) and to quantitate the adipogenic phenotype (B). A: representative images of both undifferentiated fibroblasts (top) and adipocytes (bottom) are shown. Image panels (left to right) show brightfield (BRF), LTX (red), Thy-1 (green), and nuclei (DNA) stained with Draq5 (pink). B: live single cells were identified as described in materials and methods. Thy-1-negative and Thy-1-positive cells were identified based on the intensity of Thy-1 expression. Top, cells from the Thy-1-negative region; bottom, cells from the Thy-1-positive region. Adipocytes were distinguished from undifferentiated fibroblasts based on the intensity (y-axis) and frequency (x-axis) of LTX staining. The numerical percentage value on each dot-plot refers to the percentage of cells contained within the adipocyte region.
Fig. 2.
Fig. 2.
ImageStream analysis confirms the results of other adipogenesis assays when used in 3T3-L1 mouse embryonic fibroblasts, a standard model of adipogenesis. 3T3-L1 cells were differentiated as described in materials and methods. A: cells were stained for cytoplasmic lipid droplets by Oil Red O. Left, an undifferentiated culture; right, a differentiated culture. B: the triglyceride content of the cells was measured in a colorimetric triglyceride assay. Values are means + SD; n = 3; *P < 0.01 by Student's t-test for differentiated cells versus undifferentiated cells. C and D: cells were stained to measure the accumulation of neutral lipids into droplets using LTX. An Amnis ImageStream imaging flow cytometer was used to visualize cells (C) and to quantitate the adipogenic phenotype (D). C: representative images of both undifferentiated cells (left) and adipocytes (right) are shown. Image panels (left to right) show brightfield (BRF), LTX (red), and nuclei (DNA) stained with Draq5 (pink). D: live single cells were identified as described in materials and methods. Adipocytes were distinguished from undifferentiated cells based on the intensity (y-axis) and frequency (x-axis) of LTX staining. The numerical percentage value on each dot-plot refers to the percentage of cells contained within the adipocyte region.
Fig. 3.
Fig. 3.
ImageStream analysis demonstrates that, when cultured separately, Thy-1-negative primary human orbital fibroblasts are much more prone to adipogenic differentiation than are their Thy-1-positive counterparts. Human orbital fibroblasts were sorted, differentiated, and stained for neutral lipid droplet formation as described in materials and methods and in the legend to Fig. 1. Adipocytes were identified based on the intensity (y-axis) and frequency (x-axis) of LTX staining. The numerical percentage value on each dot-plot refers to the percentage of cells contained within the adipocyte region. Shown are representative plots from the Thy-1-positive sorted subset, undifferentiated (top left) and differentiated (top right), and the Thy-1-negative sorted subset, undifferentiated (bottom left) and differentiated (bottom right).
Fig. 4.
Fig. 4.
Medium conditioned by Thy-1-positive primary human orbital fibroblasts inhibits adipogenic differentiation of these cells. Human orbital fibroblasts were sorted as described in materials and methods. Sorted populations were treated with conditioned medium from cells of the same or the opposing subset and with 0–5 μM 15d-PGJ2 (as indicated by labels at the top). Left labels indicate the Thy-1 sorted subset from which the cells in each sample were derived and the source of the conditioned medium. Samples were stained for neutral lipid droplet formation as described in the legend to Fig. 1. Adipocytes were identified based on the intensity (y-axis) and frequency (x-axis) of LTX staining. The numerical percentage value on each dot-plot refers to the percentage of cells contained within the adipocyte region.
Fig. 5.
Fig. 5.
Medium conditioned by Thy-1-positive primary human orbital fibroblasts inhibits both adipogenic differentiation and ligand-activated binding of peroxisome proliferator-activated receptor-γ (PPARγ) to the PPAR response element (PPRE) but not via an increased abundance of TGF-β1, PGF, or PGE2. A: human orbital fibroblasts were sorted as described in materials and methods. Sorted populations were treated with conditioned medium from cells of the same or the opposing subset and with 0–5 μM 15d-PGJ2. After 8 days of treatment, the triglyceride content of the orbital fibroblasts was measured using a colorimetric triglyceride assay. The labels on the x-axis indicate the Thy-1-sorted subset from which the cells in each sample were derived (cells) and the Thy-1-sorted subset from which the conditioned medium in each sample was derived (medium). Open bars, untreated samples; solid bars, samples treated with 15d-PGJ2. As indicated, cells from the Thy-1-negative sorted subset treated with 15d-PGJ2 in conditioned medium from Thy-1-positive sorted cells accumulate significantly less triglyceride (P < 0.00001 by Student's t-test) than cells from the same subset treated in conditioned medium from Thy-1-negative sorted cells. Means + SD; n = 3. B: human orbital fibroblasts were sorted as described in materials and methods. Cells from the Thy-1-negative sorted subset were treated with conditioned medium from cells of the same or the opposing subset and with 0–5 μM 15d-PGJ2. After 2 days of treatment, nuclear lysates were prepared from the cultures and replicate samples were assayed for PPARγ binding to the PPRE consensus sequence as described in materials and methods. Means + SD; n = 3; P values by Student's t-test. C: replicate portions of conditioned media from the Thy-1-negative and Thy-1-positive-sorted subsets of orbital fibroblasts were collected after 2 days in culture and then assayed for content of transforming growth factor-β1 (TGF-β1), prostaglandin E2 (PGE2), and prostaglandine F (PGF) as described in materials and methods. Similar levels of each anti-adipogenic factor were detectable above media alone level. Means + SD; n = 3.
Fig. 6.
Fig. 6.
Adipogenesis is inhibited in 3T3-L1 mouse embryonic fibroblasts treated with conditioned culture medium from Thy-1-positive human orbital fibroblasts. 3T3-L1 cells were differentiated as described in materials and methods except that the culture medium used was first conditioned by 3T3-L1 cells or by Thy-1-positive or Thy-1-negative orbital fibroblast cultures. Cells were assayed via AdipoRed (A) to quantify the amount of lipid accumulation (values are means + SD, n = 12, **P < 0.001) and by ImageStream (B) to quantify the percentage of cells differentiated to adipocytes. Both analyses showed a suppression of adipogenesis when conditioned medium from Thy-1-positive orbital fibroblasts was added.
Fig. 7.
Fig. 7.
Thy-1 expression is suppressed by Thy-1 small interfering RNA (siRNA) in primary human orbital fibroblasts, enhancing the adipogenic potential of these cells. Human orbital fibroblasts were transfected with a Thy-1 siRNA contruct or a control siRNA. After culture for 3 days, the cells were differentiated as described in materials and methods. A: real-time RT-PCR analysis shows that Thy-1 transcription was suppressed by 95% with the Thy-1 siRNA construct compared with the control siRNA. Relative expression of Thy-1 mRNA was normalized to 18S ribosomal RNA for each sample, and mRNA expression of Thy-1 siRNA-treated cells was expressed as a percentage of control siRNA-treated cells. B: transfected cells were analyzed by flow cytometry as described in materials and methods. After Thy-1 siRNA transfection, 36% fewer cells expressed surface Thy-1 molecules and Thy-1 siRNA-transfected cells showed a 10-fold decrease in median fluorescence intensity compared with control siRNA-transfected cells. C: following transfection and differentiation, lipid-containing vacuole accumulation in the cytoplasm was analyzed by AdipoRed assay, showing a significant increase in lipid accumulation for Thy-1 siRNA-transfected cells over control siRNA-transfected cells. Valuesa are means + SD, n = 40; **P < 0.01.

Similar articles

Cited by

References

    1. Baglole CJ, Reddy SY, Pollock SJ, Feldon SE, Sime PJ, Smith TJ, Phipps RP. Isolation and phenotypic characterization of lung fibroblasts. Methods Mol Med 117: 115–127, 2005 - PubMed
    1. Bahn RS, Heufelder AE. Pathogenesis of Graves' ophthalmopathy. N Engl J Med 329: 1468–1475, 1993 - PubMed
    1. Blouin K, Boivin A, Tchernof A. Androgens and body fat distribution. J Steroid Biochem Mol Biol 108: 272–280, 2008 - PubMed
    1. Boyanov MA, Boneva Z, Christov VG. Testosterone supplementation in men with type 2 diabetes, visceral obesity and partial androgen deficiency. Aging Male 6: 1–7, 2003 - PubMed
    1. Crandall DL, Busler DE, Novak TJ, Weber RV, Kral JG. Identification of estrogen receptor beta RNA in human breast and abdominal subcutaneous adipose tissue. Biochem Biophys Res Commun 248: 523–526, 1998 - PubMed

Publication types

MeSH terms

LinkOut - more resources