. 2010 Jun 16;30(24):8285-95.
doi: 10.1523/JNEUROSCI.0976-10.2010.

Pivotal role of TLR4 receptors in alcohol-induced neuroinflammation and brain damage

Affiliations

Pivotal role of TLR4 receptors in alcohol-induced neuroinflammation and brain damage

Silvia Alfonso-Loeches et al. J Neurosci. .

Abstract

Toll-like receptors play an important role in the innate immune response, although emerging evidence indicates their role in brain injury and neurodegeneration. Alcohol abuse induces brain damage and can sometimes lead to neurodegeneration. We recently found that ethanol can promote TLR4 signaling in glial cells by triggering the induction of inflammatory mediators and causing cell death, suggesting that the TLR4 response could be an important mechanism of ethanol-induced neuroinflammation. This study aims to establish the potential role of TLR4 in both ethanol-induced glial activation and brain damage. Here we report that TLR4 is critical for ethanol-induced inflammatory signaling in glial cells since the knockdown of TLR4, by using both small interfering RNA or cells from TLR4-deficient mice, abolished the activation of microtubule-associated protein kinase and nuclear factor-kappaB pathways and the production of inflammatory mediators by astrocytes. Our results demonstrate, for the first time, that whereas chronic ethanol intake upregulates the immunoreactive levels of CD11b (microglial marker) and glial fibrillary acidic protein (astrocyte marker), and also increases caspase-3 activity and inducible nitric oxide synthase, COX-2, and cytokine levels [interleukin (IL)-1beta, tumor necrosis factor-alpha, IL-6] in the cerebral cortex of female wild-type mice, TLR4 deficiency protects against ethanol-induced glial activation, induction of inflammatory mediators, and apoptosis. Our findings support the critical role of the TLR4 response in the neuroinflammation, brain injury, and possibly in the neurodegeneration induced by chronic ethanol intake.


Figures
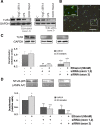
Figure 1.
Figure 1.
Gene silencing of TLR4 downregulates the TLR4 expression and reduces NFκB activation induced by ethanol in astrocytes in culture. A, Western blot of TLR4 in astrocytes. At 48 h after transfection with different siRNAs, cells were stimulated with either LPS (50 ng/ml) or ethanol (50 mm) for 30 min. A negative control for siRNA (NegC siRNA), untransfected cells [control (C)], and GAPDH (loading control) were assessed. B, Transfection efficiency was determined by using pmax-GFP plasmid (scale bar, 200 μm). The inset shows details of astrocytes expressing GFP (scale bar, 50 μm). C, D, Forty-eight hours after transfection with TLR4 siRNA (silencing either exon 1/2 boundary or exon 3), astrocytes were stimulated with ethanol (50 mm) for 30 min, and the TLR4 and NFκB-p65 levels were determined in cell lysates or nuclear extracts, respectively. GAPDH and Lamin A/C were used as loading controls. A representative Western blot of each protein is shown. Data show the average of three to four independent experiments. Densitometry values represent the mean ± SEM (*p < 0.05; **p < 0.01; ***p < 0.001; Student's t test).
Figure 2.
Figure 2.
CD14 and MD-2 are involved in the ethanol-induced TLR4 response. A, Rat astrocytes were transfected with siRNA targeting CD14 or MD-2 or with a nontargeting control (ON-TARGETplus SMART pool siRNA). After 96 h of transfection, cells were stimulated with either LPS (50 ng/ml) or ethanol (50 mm) for 10 or 30 min, and the levels of pERK and NFκB-p65 were determined in cell lysates or nuclear extracts, respectively. A representative Western blot of each protein is shown. B, Rat astrocytes were preincubated with anti-CD14 mAb, 30 min before and during the 3 h of LPS (50 ng/ml) or ethanol (50 mm) treatment. C, In some experiments, cells were treated with LPS or ethanol for 3 h, in the presence or in the absence of Polymixin B (10 μg/ml). The IL-1β mRNA levels in cells were measured. Data show the average of three independent experiments. Densitometry values represent the mean ± SEM (*p < 0.05; **p ≤ 0.01; ***p < 0.001; p < 0.05; Student's t test). C, Control; ns, not significant.
Figure 3.
Figure 3.
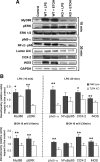
Effects of ethanol on TLR4 signaling and the iNOS and COX-2 levels in the astrocytes of the WT and TLR4-KO mice. A, Astrocytes were stimulated with either LPS (50 ng/ml) or ethanol (10 mm) for 10 or 30 min. The levels of MyD88 and pERK were analyzed after 10 min of LPS or ethanol stimulation. Phosphorylation of the IκB-α, (pIκB-α), NFκB-p65, COX-2, and iNOS levels was assessed after 30 min during LPS or ethanol treatment. A representative Western blot of each protein is shown. GAPDH, ERK 1/2, and Lamin A/C were used as loading controls. B, Densitometry values represent the mean ± SEM. from at least six individual experiments (*p < 0.05; **p < 0.01; Student's t test).
Figure 4.
Figure 4.
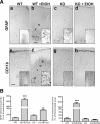
Coronal brain sections of the medial frontal cortex of both WT and TLR4-KO mice with or without chronic ethanol treatment were immunostained for GFAP and CD11b. A, A significant upregulation of GFAP (b) and CD11b (f) immunoreactivity was observed in the ethanol-treated WT mice versus the WT nontreated controls (a, e; scale bar, 200 μm). Some hypertrophic astrocytes (GFAP immunoreactivity) surrounding the lesion area (layers IV–VI) are observed in the ethanol-treated WT mice (b). The inset in b shows details of astrocytic hypertrophy (scale bar, 20 μm). In the ethanol-treated TLR4-KO mice, a moderate increase in the GFAP immunoreactivity is also noted (d) when compared with the nontreated TLR4-KO animals (c). No significant changes in CD11b immunoreactivity were observed between the ethanol-treated (h) and the nontreated KO (g) mice (scale bars: 200 μm; inset, 50 μm). B, Bars represent the values of the quantification of GFAP and CD11b immunoreactivity expressed as the percentage of the thresholded area occupied by the specific staining in relation to the whole area versus the WT control. Values represent the mean ± SD. of three animals per group and five to six high-power fields analyzed per coverslip. **p < 0.01; ***p < 0.001 (Mann–Whitney U nonparametric test, with a Kolmogorov–Smirnov normality test).
Figure 5.
Figure 5.
Chronic ethanol intake increases the levels of MyD88, pERK, CD14, and NFκB-p65. Western blot analysis of MyD88, pERK, and CD14 was performed in total cerebral cortex homogenates (A), whereas that of NFκB and IκB-α was performed in the nuclear or cytoplasmic extracts (B), respectively. GAPDH and Lamin A/C were used as loading controls. A representative blot of each protein is shown. Bars represent the densitometry quantification of three to four different experiments. Values represent the mean ± SEM. *p < 0.05; **p < 0.01 (Mann–Whitney U nonparametric test, with a Kolmogorov–Smirnov normality test or a Student's t test).
Figure 6.
Figure 6.
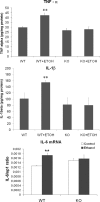
Levels of TNF-α (top), IL-1β (middle), and IL-6 mRNA (bottom) from brain cortex homogenates. Analysis of TNF-α and IL-1β was conducted by ELISA, whereas IL-6 cytokine mRNA was measured by RT-PCR. Values represent the mean ± SEM. of five to eight individual experiments, **p < 0.01 (Mann–Whitney U nonparametric test, with a Kolmogorov–Smirnov normality test or a Student's t test).
Figure 7.
Figure 7.
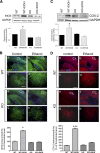
Role of the TLR4 receptors in the ethanol-induced upregulation of the iNOS and COX-2 expressions in the cerebral cortices. A, C, The iNOS and COX-2 protein levels were assessed by Western blotting analysis in the cerebral cortices of the WT and the TLR4-KO mice treated with or without alcohol for 5 months. Values represent the mean ± SEM. of four to six independent experiments. *p < 0.05 (Student's t test). B, D, iNOS and COX-2 immunostaining was performed in the brain sections from the medial frontal cortex (scale bars: a, b, e, f, 200 μm; c, d, g, h, 50 μm). Bars represent the values of the quantification of iNOS and COX-2 immunoreactivity expressed as the percentage of the thresholded area occupied by the specific staining in relation to the whole area versus WT control. For quantification, five to eight high-power fields were analyzed per coverslip. Values represent the mean ± SD. of at least three animals per group; *p < 0.05 and ***p < 0.005 versus the WT control animals (Mann–Whitney U nonparametric test, with a Kolmogorov–Smirnov normality test or a Student's t test).
Figure 8.
Figure 8.
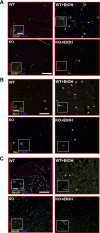
Double-labeling immunofluorescence of COX-2 with GFAP+ astrocytes, or Iba1+ microglial cells, or NeuN+ neurons in the medial frontal cortex of the WT and TLR4-KO mice treated with or without ethanol for 5 months. Images were acquired using a Leica TCS-SP2-AOBA confocal laser-scanning microscope. Immunolabeling of COX-2 (red) with GFAP+ astrocytes (A), or with Iba1+cells (B), or with NeuN+ neurons (C) is shown. A high proportion of the immunoreactivity of COX-2 colocated with astrocytes or microglia or neurons from the brain sections from ethanol-treated WT mice (asterisks). Scale bars, 75 μm. Higher-magnification images from boxes, 15 μm.
Figure 9.
Figure 9.
Caspase-3 levels in the frontal cortex of both the WT and TLR4-KO mice treated with or without chronic ethanol treatment. A, Significant upregulation of caspase-3 immunostaining was observed in the medial frontal cortex of the WT mice treated with ethanol versus the nontreated control animals. DAB with hematoxylin counterstain (scale bars: 200 μm; inset, 50 μm) is shown. Quantification values of caspase-3 immunoreactivity represent the mean ± SEM (3 animals per group), with 10 high-power fields analyzed per coverslip. ***p < 0.001 (Mann–Whitney U nonparametric test, with a Kolmogorov–Smirnov normality test). B, Western blot analysis showing the caspase-3 cleavage fragment of ∼17 kDa in the cerebral cortices of the WT mice chronically treated with ethanol. GAPDH was used as a loading control. C, Levels of caspase-3 mRNA. Values represent the mean ± SEM. of six animals per group. *p < 0.05 (Student's t test).

Similar articles

Cited by

References

    1. Adachi J, Mizoi Y, Fukunaga T, Ogawa Y, Ueno Y, Imamichi H. Degrees of alcohol intoxication in 117 hospitalized cases. J Stud Alcohol. 1991;52:448–453. - PubMed
    1. Akashi S, Saitoh S, Wakabayashi Y, Kikuchi T, Takamura N, Nagai Y, Kusumoto Y, Fukase K, Kusumoto S, Adachi Y, Kosugi A, Miyake K. Lipopolysaccharide interaction with cell surface Toll-like receptor 4-MD-2: higher affinity than that with MD-2 or CD14. J Exp Med. 2003;198:1035–1042. - PMC - PubMed
    1. Akira S, Takeda K. Toll-like receptor signalling. Nat Rev Immunol. 2004;4:499–511. - PubMed
    1. Barcia C, Sanderson NS, Barrett RJ, Wawrowsky K, Kroeger KM, Puntel M, Liu C, Castro MG, Lowenstein PR. T cells' immunological synapses induce polarization of brain astrocytes in vivo and in vitro: a novel astrocyte response mechanism to cellular injury. PLoS One. 2008;3:e2977. - PMC - PubMed
    1. Blanco AM, Guerri C. Ethanol intake enhances inflammatory mediators in brain: role of glial cells and TLR4/IL-1RI receptors. Front Biosci. 2007;12:2616–2630. - PubMed

Publication types

MeSH terms

Substances