

In vitro vs in silico detected SNPs for the development of a genotyping array: what can we learn from a non-model species?
- PMID: 20543950
- PMCID: PMC2882948
- DOI: 10.1371/journal.pone.0011034
In vitro vs in silico detected SNPs for the development of a genotyping array: what can we learn from a non-model species?
Abstract
Background: There is considerable interest in the high-throughput discovery and genotyping of single nucleotide polymorphisms (SNPs) to accelerate genetic mapping and enable association studies. This study provides an assessment of EST-derived and resequencing-derived SNP quality in maritime pine (Pinus pinaster Ait.), a conifer characterized by a huge genome size ( approximately 23.8 Gb/C).
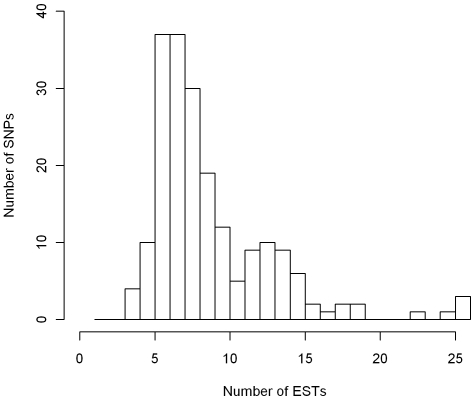
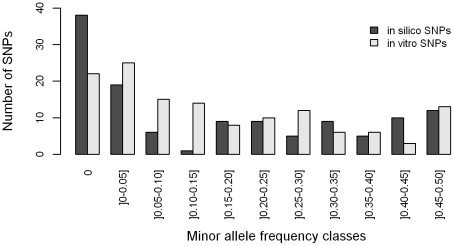
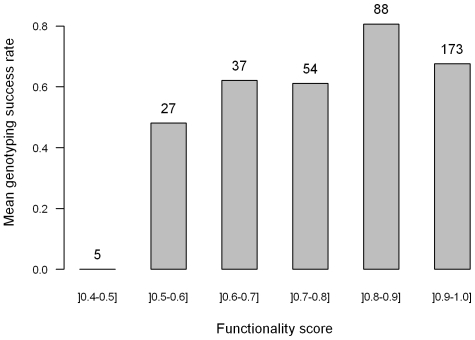
Methodology/principal findings: A 384-SNPs GoldenGate genotyping array was built from i/ 184 SNPs originally detected in a set of 40 re-sequenced candidate genes (in vitro SNPs), chosen on the basis of functionality scores, presence of neighboring polymorphisms, minor allele frequencies and linkage disequilibrium and ii/ 200 SNPs screened from ESTs (in silico SNPs) selected based on the number of ESTs used for SNP detection, the SNP minor allele frequency and the quality of SNP flanking sequences. The global success rate of the assay was 66.9%, and a conversion rate (considering only polymorphic SNPs) of 51% was achieved. In vitro SNPs showed significantly higher genotyping-success and conversion rates than in silico SNPs (+11.5% and +18.5%, respectively). The reproducibility was 100%, and the genotyping error rate very low (0.54%, dropping down to 0.06% when removing four SNPs showing elevated error rates).
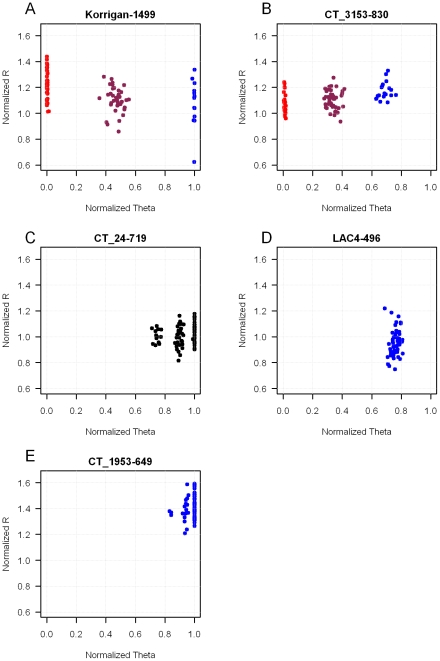
Conclusions/significance: This study demonstrates that ESTs provide a resource for SNP identification in non-model species, which do not require any additional bench work and little bio-informatics analysis. However, the time and cost benefits of in silico SNPs are counterbalanced by a lower conversion rate than in vitro SNPs. This drawback is acceptable for population-based experiments, but could be dramatic in experiments involving samples from narrow genetic backgrounds. In addition, we showed that both the visual inspection of genotyping clusters and the estimation of a per SNP error rate should help identify markers that are not suitable to the GoldenGate technology in species characterized by a large and complex genome.
Conflict of interest statement
Figures
Similar articles
-
Western white pine SNP discovery and high-throughput genotyping for breeding and conservation applications.BMC Plant Biol. 2014 Dec 30;14:380. doi: 10.1186/s12870-014-0380-6. BMC Plant Biol. 2014. PMID: 25547170 Free PMC article.
-
Development and implementation of a highly-multiplexed SNP array for genetic mapping in maritime pine and comparative mapping with loblolly pine.BMC Genomics. 2011 Jul 18;12:368. doi: 10.1186/1471-2164-12-368. BMC Genomics. 2011. PMID: 21767361 Free PMC article.
-
Automated SNP detection in expressed sequence tags: statistical considerations and application to maritime pine sequences.Plant Mol Biol. 2004 Feb;54(3):461-70. doi: 10.1023/B:PLAN.0000036376.11710.6f. Plant Mol Biol. 2004. PMID: 15284499
-
Development and characterisation of an expressed sequence tags (EST)-derived single nucleotide polymorphisms (SNPs) resource in rainbow trout.BMC Genomics. 2012 Jun 13;13:238. doi: 10.1186/1471-2164-13-238. BMC Genomics. 2012. PMID: 22694767 Free PMC article.
-
Development of high-throughput SNP-based genotyping in Acacia auriculiformis x A. mangium hybrids using short-read transcriptome data.BMC Genomics. 2012 Dec 24;13:726. doi: 10.1186/1471-2164-13-726. BMC Genomics. 2012. PMID: 23265623 Free PMC article.
Cited by
-
High-throughput SNP genotyping in Cucurbita pepo for map construction and quantitative trait loci mapping.BMC Genomics. 2012 Feb 22;13:80. doi: 10.1186/1471-2164-13-80. BMC Genomics. 2012. PMID: 22356647 Free PMC article.
-
Genetic parallelism between European flat oyster populations at the edge of their natural range.Evol Appl. 2022 Aug 6;16(2):393-407. doi: 10.1111/eva.13449. eCollection 2023 Feb. Evol Appl. 2022. PMID: 36793680 Free PMC article.
-
Western white pine SNP discovery and high-throughput genotyping for breeding and conservation applications.BMC Plant Biol. 2014 Dec 30;14:380. doi: 10.1186/s12870-014-0380-6. BMC Plant Biol. 2014. PMID: 25547170 Free PMC article.
-
Population structure and genetic diversity characterization of a sunflower association mapping population using SSR and SNP markers.BMC Plant Biol. 2015 Feb 13;15:52. doi: 10.1186/s12870-014-0360-x. BMC Plant Biol. 2015. PMID: 25848813 Free PMC article.
-
High-throughput SNP genotyping in the highly heterozygous genome of Eucalyptus: assay success, polymorphism and transferability across species.BMC Plant Biol. 2011 Apr 14;11:65. doi: 10.1186/1471-2229-11-65. BMC Plant Biol. 2011. PMID: 21492434 Free PMC article.
References
-
- Henry RJ. Plant Genotyping II: SNP Technology. New York: Oxford University Press; 2008. 285
-
- Rafalski A. Applications of single nucleotide polymorphisms in crop genetics. Current Opinion in Plant Biology. 2002;5:94–100. - PubMed
-
- Rafalski JA. Novel genetic mapping tools in plants: SNPs and LD-based approaches. Plant Science. 2002;162:329–333.
-
- Gupta PK, Roy JK, Prasad M. Single nucleotide polymorphisms: a new paradigm for molecular marker technology and DNA polymorphism detection with emphasis on their use in plants. Current Science. 2001;80:524–535.
Publication types
MeSH terms
LinkOut - more resources
Full Text Sources
Research Materials
