. 2010 Aug 6;285(32):25053-61.
doi: 10.1074/jbc.M109.095257. Epub 2010 Jun 10.

Modulation of endoplasmic reticulum Ca2+ store filling by cyclic ADP-ribose promotes inositol trisphosphate (IP3)-evoked Ca2+ signals

Affiliations

Modulation of endoplasmic reticulum Ca2+ store filling by cyclic ADP-ribose promotes inositol trisphosphate (IP3)-evoked Ca2+ signals

Michiko Yamasaki-Mann et al. J Biol Chem. .

Abstract

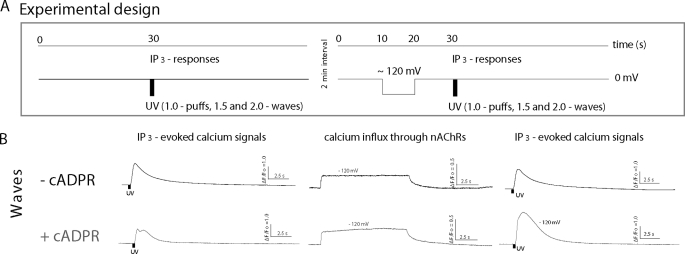
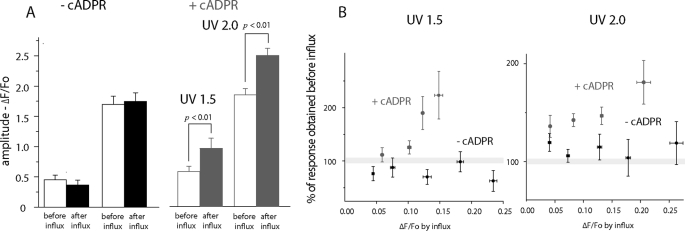
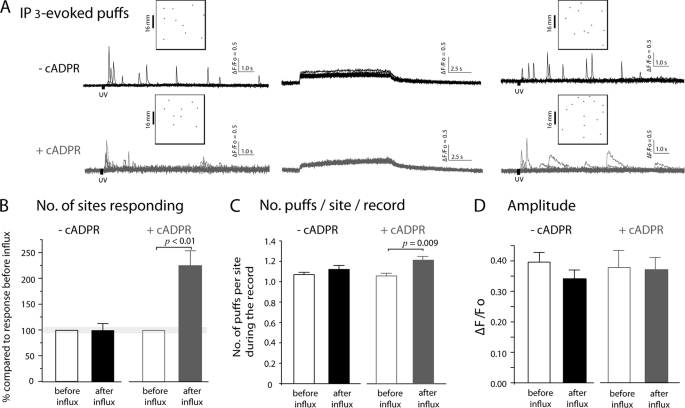
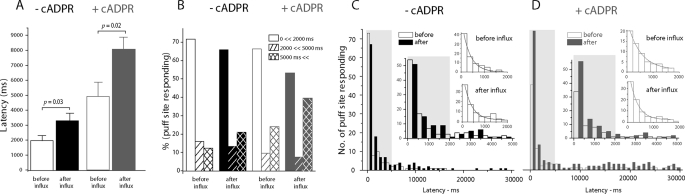
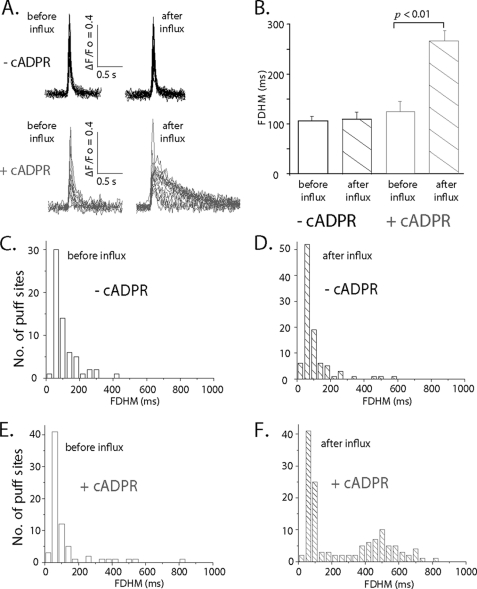
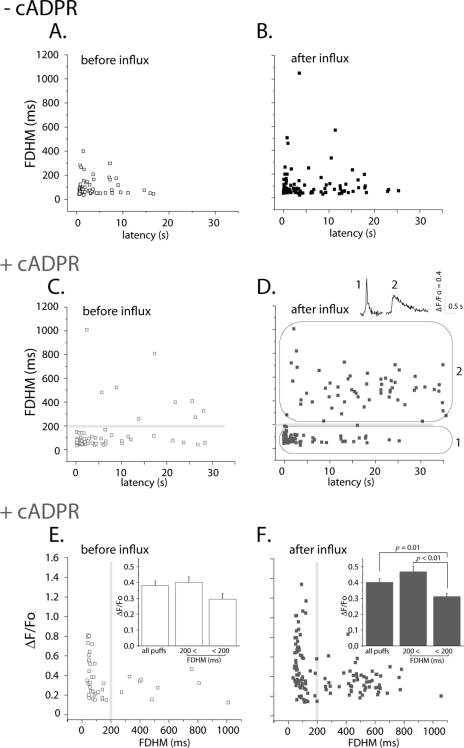
In addition to its well established function in activating Ca(2+) release from the endoplasmic reticulum (ER) through ryanodine receptors (RyR), the second messenger cyclic ADP-ribose (cADPR) also accelerates the activity of SERCA pumps, which sequester Ca(2+) into the ER. Here, we demonstrate a potential physiological role for cADPR in modulating cellular Ca(2+) signals via changes in ER Ca(2+) store content, by imaging Ca(2+) liberation through inositol trisphosphate receptors (IP(3)R) in Xenopus oocytes, which lack RyR. Oocytes were injected with the non-metabolizable analog 3-deaza-cADPR, and cytosolic [Ca(2+)] was transiently elevated by applying voltage-clamp pulses to induce Ca(2+) influx through expressed plasmalemmal nicotinic channels. We observed a subsequent potentiation of global Ca(2+) signals evoked by strong photorelease of IP(3), and increased numbers of local Ca(2+) puffs evoked by weaker photorelease. These effects were not evident with cADPR alone or following cytosolic Ca(2+) elevation alone, indicating that they did not arise through direct actions of cADPR or Ca(2+) on the IP(3)R, but likely resulted from enhanced ER store filling. Moreover, the appearance of a new population of puffs with longer latencies, prolonged durations, and attenuated amplitudes suggests that luminal ER Ca(2+) may modulate IP(3)R function, in addition to simply determining the size of the available store and the electrochemical driving force for release.


Figures

FIGURE 1.
FIGURE 1.
Experimental protocol and representative examples of IP3-evoked global Ca2+ signals before and after evoking Ca2+ influx. A, schematic of the flash photolysis and voltage-clamp protocol. Oocytes were clamped at a holding potential of 0 mV, and IP3 was photoreleased to evoke global Ca2+ waves (left). After a 2-min interval, a voltage pulse to −120 mV was applied for 10 s to drive Ca2+ influx through nAChR, followed 10 s later by a photolysis flash of the same strength (right). B, representative examples of fluorescence profiles of IP3-evoked global Ca2+ responses, before (left) and after (right) Ca2+ influx, recorded in oocytes without (top) and with cADPR (bottom). Localization of puff events in the imaging field is mapped in sent panels. IP3-evoked Ca2+ signal is greater after induction of Ca2+ influx in the presence of 3-deaza-cADPR. Traces in the middle show Ca2+ fluorescence recorded during the hyperpolarizing voltage pulses.
FIGURE 2.
FIGURE 2.
IP3-induced global Ca2+ signals are potentiated following Ca2+ influx in oocytes injected with 3-deaza-cADPR. A, mean peak amplitudes of IP3-induced global Ca2+ signals (ΔF/Fo), evoked by UV flashes with normalized strengths of 1.5 and 2.0 in control (left) and 3-deaza-cADPR-injected oocytes (right). Open bars show measurements before Ca2+ influx, and filled bars are paired measurements from the same oocytes after influx. B, potentiation of IP3-evoked signals as a function of magnitude of Ca2+ influx during the hyperpolarizing pulse. Measurements of IP3-evoked responses on the ordinate are expressed as a percentage of the control value in each oocyte prior to the hyperpolarizing pulse. The abscissa shows plateau levels of fluorescence change (ΔF/Fo) attained during the pulse, with data grouped into bins as indicated by horizontal error bars (+1 S.E.). Results are shown for two different UV photolysis flash strengths, without (black symbols) and with 3-deaza-cADPR (red). n = 10 oocytes, each examined before and after loading 3-deaza-cADPR, and 1 additional control oocyte. Data show mean ΔF/Fo ± S.E. of measurements from between 4 and 10 regions of interest in each oocyte.
FIGURE 3.
FIGURE 3.
Effects of prior Ca2+ influx on puffs in oocytes injected with 3-deaza-cADPR. A, representative examples of local fluorescence signals showing puffs evoked before and after Ca2+ influx. Superimposed traces show recordings from 10 puff sites before influx and 11 sites after influx in control oocytes (black); and from 9 sites before influx and 14 sites after influx in oocytes injected with 3-deaza-cADPR (gray). B, following Ca2+ influx in oocytes injected with 3-deaza-cADPR the numbers of puff sites responding to photoreleased IP3 were greatly increased. Data are normalized to the numbers of sites responding to photoreleased IP3 in each oocyte before influx. C, mean numbers of puffs observed at each responding site during 35-s recordings following photolysis flashes. In oocytes lacking 3-deaza-cADPR, puff frequencies did not change after Ca2+ influx (before Ca2+ influx 1.07 ± 0.02 puffs per site and after 1.12 ± 0.04, p < 0.05). Oocytes injected with 3-deaza-cADPR exhibited a significant increase in frequency following Ca2+ influx (1.06 ± 0.02 puffs per site before influx, 1.21 ± 0.03 after influx, p = 0.01). D, mean amplitudes (ΔF/Fo) of initial puffs observed at each responding site before and after Ca2+ influx in control and 3-deaza-cADPR-injected oocytes (before Ca2+ influx ΔF/Fo 0.39 ± 0.03, 116 puffs, after Ca2+ influx ΔF/Fo 0.34 ± 0.03, 126 puffs: oocytes injected with 3-deaza-cADPR; before Ca2+ influx ΔF/Fo 0.38 ± 0.06, 86 puffs, after Ca2+ influx, ΔF/Fo 0.37 ± 0.04, 176 puffs). There are no significant differences (p > 0.05). All data in this figure were obtained from 11 control oocytes and 10 oocytes injected with 3-deaza-cADPR, obtained from 5 frogs.
FIGURE 4.
FIGURE 4.
Changes in first-puff latencies with Ca2+ influx and 3-deaza-cADPR. Latencies were measured as the time from end of the photolysis flash to the observation of the first puff at any given site. A, mean values of latencies in control and 3-deaza-cADPR-injected oocytes before (open bars) and after (filled bars) Ca2+ influx. Paired measurements were made in each oocyte before and after Ca2+ influx and show significant differences for both experimental groups; but wide experimental variation between oocytes makes statistical comparison difficult between control and 3-deaza-cADPR groups. B, increases in mean puff latencies with Ca2+ influx and 3-deaza-cADPR largely arise from the appearance of long-latency puffs. Histograms show the proportion of initial puffs under each experimental condition that arose within <2s, 2–5s, and >5s following the photolysis flash. C and D, distributions of first-puff latencies before (open bars) and after Ca2+ influx (filled bars) in control (C) and 3-deaza-cADPR-injected oocytes (D). Data are plotted on 3 timescales to more clearly illustrate the relative invariance of the population of short latency (<2s) puffs, and the appearance of puffs with latencies of tens of seconds. Measurements were obtained from 11 control oocytes and 10 oocytes injected with 3-deaza-cADPR. Curves are single exponential fits to data at latencies <2s.
FIGURE 5.
FIGURE 5.
Puff durations are prolonged after Ca2+ influx in 3-deaza-cADPR-injected oocytes. A, superimposed traces illustrating representative examples of puffs evoked before (left) and after (right) Ca2+ influx before and after injection of 3-deaza-cADPR. B, puff durations, measured as full-duration at half-maximal (FDHM) fluorescence amplitude for each of the four experimental conditions. Data were obtained from 7 oocytes, from which paired measurements were obtained before and after loading 3-deaza-cADPR. C–F, histograms plotting distributions of first-puff latencies for each condition. Data are from 7 oocytes from 3 different frogs.
FIGURE 6.
FIGURE 6.
Long latency puffs observed after Ca2+ influx in the presence of 3-deaza-cADPR also exhibit prolonged durations. A–D, graphs show scatter plots of latencies of initial puffs versus their durations (FDHM) for each of the four experimental conditions. Ca2+ influx in 3-deaza-cADPR-injected oocytes resulted in the appearance of a population of long-latency, prolonged puffs (region marked as 2 in D), distinct from the population of short-latency, brief puffs (region 1) that was predominant in the other experimental conditions. Insets in D illustrate typical examples of puffs from these two populations. Data are from the same oocytes used for analysis in Fig. 5. E and F, scatter plots of durations (FDHM) of initial puffs versus their peak amplitudes, measured in cADPR-injected oocytes before and after Ca2+ influx, respectively. Insets present mean values for all puffs, puffs with FDHM <200 ms, and puffs with FDHM >200 ms. Respective puff amplitudes before influx were ΔF/Fo 0.38 ± 0.03 (pooling all 62 puffs), 0.40 ± 0.03 (53/72 puffs with FDHM < 200 ms) and 0.29 ± 0.03 (9/62 puffs 56/132 puffs with FDHM > 200 ms): and for puffs after influx 0.40 ± 0.02 (pooling al 132 puffs), 0.46 ± 0.03 (76/132 puffs with FDHM < 200 ms) and 0.31 ± 0.02 (56/132 puffs with FDHM > 200 ms).

Similar articles

Cited by

References

    1. Berridge M. J., Bootman M. D., Roderick H. L. (2003) Nat. Rev. Mol. Cell Biol. 4, 517–529 - PubMed
    1. Camacho P., Lechleiter J. D. (1993) Science 260, 226–229 - PubMed
    1. Albrecht M. A., Colegrove S. L., Friel D. D. (2002) J. Gen. Physiol. 119, 211–233 - PMC - PubMed
    1. Yano K., Petersen O. H., Tepikin A. V. (2004) Biochem. J. 383, 353–360 - PMC - PubMed
    1. Friel D. (2004) Biol. Res. 37, 665–674 - PubMed

Publication types

LinkOut - more resources