. 2010 Aug 6;285(32):24707-16.
doi: 10.1074/jbc.M109.062976. Epub 2010 Jun 7.

Identification of small molecules that suppress microRNA function and reverse tumorigenesis

Affiliations

Identification of small molecules that suppress microRNA function and reverse tumorigenesis

Koichi Watashi et al. J Biol Chem. .

Abstract

MicroRNAs (miRNAs) act in post-transcriptional gene silencing and are proposed to function in a wide spectrum of pathologies, including cancers and viral diseases. Currently, to our knowledge, no detailed mechanistic characterization of small molecules that interrupt miRNA pathways have been reported. In screening a small chemical library, we identified compounds that suppress RNA interference activity in cultured cells. Two compounds were characterized; one impaired Dicer activity while the other blocked small RNA-loading into an Argonaute 2 (AGO2) complex. We developed a cell-based model of miRNA-dependent tumorigenesis, and using this model, we observed that treatment of cells with either of the two compounds effectively neutralized tumor growth. These findings indicate that miRNA pathway-suppressing small molecules could potentially reverse tumorigenesis.


Figures
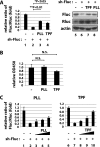
FIGURE 1.
FIGURE 1.
PLL and TPF suppress shRNA-mediated gene silencing. A, 293T cells were transfected with expression plasmids for firefly (Fluc) and Renilla luciferase (Rluc) together with a shRNA that targets Fluc (sh-Fluc, lanes 2–4) or a control irrelevant shRNA (sh-control, lane 1). Sh-Fluc is designed to silence Fluc, but not Rluc. In parallel, cells were treated with 3.3 μm PLL (lane 3), 3.3 μm TPF (lane 4), or were untreated (lanes 1 and 2). In the left graph, luciferase activities were quantified at 24 h post treatment, and Fluc/Rluc ratios are graphed based on the averages from three independent experiments. In the right panels, Fluc (top), Rluc (middle), and actin (bottom) as an internal control were immunoblotted. Effective silencing of Fluc by sh-Fluc was seen in lane 2 while treatment with PLL (lane 3) or TPF (lane 4) reduced the effectiveness of silencing. B, MTT assays for cell viability of control-treated or PLL- or TPF-treated cells. C, dose-dependent suppression of shRNA silencing by PLL (left) and TPF (right). 293T cells were transfected with plasmids as in A and then treated with escalating amounts of PLL (0, 0, 0.31, 1.3, and 5.0 μm in lanes 1–5) or TPF (0, 0, 1.5, 3.3, and 7.5 μm in lanes 6–10). Luciferase activities were quantified as in A.
FIGURE 2.
FIGURE 2.
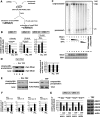
PLL and TPF inhibit small RNA biogenesis/silencing in different ways. A, schematic representation of the experimental procedure for recovering shRNA produced small RNAs in AGO2-IP and total cell fractions. 293T(FLAG·AGO2) cells after shRNA transfection and treatment with compounds were lysed and equally divided and then immediately extracted for total small siRNAs (siRNA(T); left). The lysate was also subjected to immunoprecipitation with anti-FLAG followed by the extraction of small AGO2-associated siRNAs (siRNA(A); right). B, siRNA(T) and siRNA(A) were extracted as described in A from 293T(FLAG·AGO2) cells treated with PLL, or TPF, or untreated cells (−). The amount of processed sh-GFP (si-GFP) was measured by real-time RT-PCR. The relative ratio of si-GFP in sRNA(T) (si-GFP(T), left) and that in sRNA(A) (si-GFP(A), center) from control-, PLL-, or TPF-treated cells was calculated using cells without treatment (−) set as 1. To quantify AGO2 association of si-GFP, the si-GFP(A) value was normalized by dividing with the si-GFP(T) value and graphed (right). The association of si-GFP with AGO2 (siRNA(A)/siRNA(T)) in cells treated with TPF was reduced compared with control (−) or PLL treated cells. C, in vitro Dicer assay. Various amounts of PLL (8, 4, 2, and 1 μm in lanes 3–6) or TPF (100, 10, and 1 μm in lanes 7–9) were added to the reactions. The substrate (unprocessed) and processed 32P-labeled RNAs were visualized. The presence of a “processed” band measures the Dicer enzymatic activity. The lower panel shows the amount of immunoblotted Dicer protein in each lane. Bovine serum albumin carrier protein was also blotted in each sample as a loading control. The addition of PLL, but not TPF, decreased Dicer-mediated processing of the ∼700 nt to the ∼21 nt band. D, in vitro RNA binding assay. 293T cells overexpressing myc-Dicer were treated with PLL (lane 3), TPF (lane 4), or untreated (lane 2). 293T cells, which do not express myc-Dicer, were used as a negative control (lane 1). Lysates from these cells were incubated with biotinylated pre-let-7a RNA and then precipitated with streptavidin-Sepharose. In the left panel, myc-Dicer was detected in the precipitates by immunoblotting (top). Total myc-Dicer in each sample was measured by immunoblotting at the bottom (total). In the right panel, total pre-let7a RNA in the samples used for lanes 2–4 of the left panel was quantified by real-time RT-PCR in three replicates. E, siRNA association with AGO2 after PLL or TPF treatment. 293T(FLAG·AGO2) cells treated with PLL or TPF or untreated (−) were lysed and mixed with biotinylated si-GFP RNA (left panels). si-GFP-containing complexes were captured with streptavidin beads (top) or left unprecipitated (bottom) and detected for FLAG·AGO2 by immunoblotting. siRNA association with AGO2 was reduced in lysates from cells treated with TPF but not PLL. Separately, an RNA precipitation assay with transfected RNA was performed (right panels). 293T(FLAG·AGO2) cells were transfected with biotinylated si-GFP, and cells were treated with TPF or were untreated. The cells were lysed and captured with streptavidin beads (top) or left unprecipitated (bottom) for detection of FLAG·AGO2. F, pre-miR-17, -21, -16–2, and -30a in total RNA fraction were quantified by real-time RT-PCR in 293T cells treated with PLL or untreated (−). G, 293T cells overexpressing FLAG·AGO1, -2, -3, or -4 were transfected with sh-GFP and treated with TPF or untreated (−). Left, the ratios of siRNA(A)/siRNA(T) were quantified as in Fig. 2B. Right, AGO1, -2, -3, or -4 expression was immunoblotted using anti-FLAG antibody. Anti-actin was used as a loading control.
FIGURE 3.
FIGURE 3.
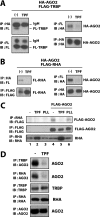
TPF disrupts the association of TRBP and RHA with AGO2. A and B, 293T cells were transfected with HA-tagged AGO2 (HA-AGO2) and FLAG-tagged TRBP (FLAG-TRBP in A) or RHA (FLAG-RHA in B). At 24 h post transfection, cells were treated without or with TPF. After a further 24 h, cells were lysed and immunoprecipitated with anti-FLAG or anti-HA. The immunoprecipitates were blotted with anti-FLAG or anti-HA as indicated. In the left panels of A, the recovered bands for the IgG heavy chain (IgH) as well as for FLAG-TRBP are indicated. Recovery of HA-AGO2 is shown in the right panels. In B, recoveries of FLAG-RHA and HA-AGO2 are shown. C, 293T cells transfected with FLAG·AGO2 (lanes 4–6) or the corresponding empty vector (lanes 1–3) were treated with TPF (lanes 2 and 5), PLL (lanes 3 and 6), or were untreated (lanes 1 and 4). Cells were lysed and immunoprecipitated with anti-RHA (top and bottom) or anti-FLAG (middle). The immunoprecipitates were blotted with anti-FLAG (top and middle) or anti-RHA (bottom). D, after 24-h treatment with TPF or untreated (−), 293T cells were lysed and immunoprecipitated with anti-TRBP, anti-RHA, or anti-AGO2 as indicated. The immunoprecipitates were blotted with anti-AGO2, anti-TRBP, or anti-RHA. Endogenous AGO2 co-precipitated with TRBP or RHA was decreased in cells treated with TPF.
FIGURE 4.
FIGURE 4.
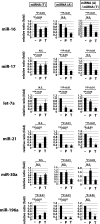
Effect of PLL or TPF treatments on the abundance of cell endogenous miRNAs. 293T(FLAG·AGO2) cells treated with 5 μm PLL (P), 10 μm TPF (T), or untreated (−) for 2 days were recovered for small RNA as described in Fig. 2A. Total miRNA or AGO2-associated miRNA fractions are termed miRNA(T) and miRNA(A), respectively. The amounts of miR-16, -17, let-7a, miR-21, -30a, and -196a were quantified using real-time RT-PCR.
FIGURE 5.
FIGURE 5.
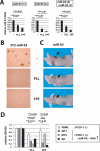
PLL and TPF treatments suppress the tumorigenic activity of miR-93 overexpressing NIH3T3 cells. A, 3T3-miR-93 cells transfected with FLAG·AGO2 were treated with PLL or TPF, or were untreated (−) for 3 days and then recovered for small RNA as described in Fig. 4. miR-93 in miRNA(T) and miRNA(A) was quantified, and the ratios of miRNA(A)/miRNA(T) are also shown. B, 3T3-miR-93 cells treated with 2 μm PLL, 1 μm TPF, or untreated were observed in a soft agar growth assay. Representative images are shown. C, 3T3-miR-93 cells were pretreated without or with PLL or TPF for 3 days and subsequently implanted into nude mice subcutaneously for observation of tumor formation. Treated cells did not form tumors in mice. Representative pictures of mice are shown. D, cell growth of HTLV-I-infected leukemic cell lines and normal PBMCs upon PLL and TPF treatment. Cell proliferation was examined by MTT assay on HTLV-1-cells, MT1, MT4, and ED, or on normal PBMC treated with 3 μm PLL, 3 μm TPF, or untreated (−) for 4 days. MT1, MT4, and ED cells all overexpress miR-93 and miR-130b. The A450 value for the untreated sample was set as 1 for each cell type. Treatment with PLL and TPF reduced the growth of HTLV-1-cells compared with normal PBMCs.

Similar articles

Cited by

References

    1. Baltimore D., Boldin M. P., O'Connell R. M., Rao D. S., Taganov K. D. (2008) Nat. Immunol. 9, 839–845 - PubMed
    1. Garofalo M., Condorelli G., Croce C. M. (2008) Curr. Opin. Pharmacol. 8, 661–667 - PubMed
    1. O'Connell R. M., Rao D. S., Chaudhuri A. A., Boldin M. P., Taganov K. D., Nicoll J., Paquette R. L., Baltimore D. (2008) J. Exp. Med. 205, 585–594 - PMC - PubMed
    1. Soifer H. S., Rossi J. J., Saetrom P. (2007) Mol. Ther. 15, 2070–2079 - PubMed
    1. Grishok A., Pasquinelli A. E., Conte D., Li N., Parrish S., Ha I., Baillie D. L., Fire A., Ruvkun G., Mello C. C. (2001) Cell 106, 23–34 - PubMed

Publication types

LinkOut - more resources