An evolutionary analysis of lateral gene transfer in thymidylate synthase enzymes
- PMID: 20525631
- PMCID: PMC2826268
- DOI: 10.1093/sysbio/syp104
An evolutionary analysis of lateral gene transfer in thymidylate synthase enzymes
Abstract
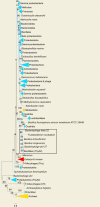
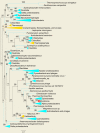
Thymidylate synthases (Thy) are key enzymes in the synthesis of deoxythymidylate, 1 of the 4 building blocks of DNA. As such, they are essential for all DNA-based forms of life and therefore implicated in the hypothesized transition from RNA genomes to DNA genomes. Two evolutionally unrelated Thy enzymes, ThyA and ThyX, are known to catalyze the same biochemical reaction. Both enzymes are sporadically distributed within each of the 3 domains of life in a pattern that suggests multiple nonhomologous lateral gene transfer (LGT) events. We present a phylogenetic analysis of the evolution of the 2 enzymes, aimed at unraveling their entangled evolutionary history and tracing their origin back to early life. A novel probabilistic evolutionary model was developed, which allowed us to compute the posterior probabilities and the posterior expectation of the number of LGT events. Simulation studies were performed to validate the model's ability to accurately detect LGT events, which have occurred throughout a large phylogeny. Applying the model to the Thy data revealed widespread nonhomologous LGT between and within all 3 domains of life. By reconstructing the ThyA and ThyX gene trees, the most likely donor of each LGT event was inferred. The role of viruses in LGT of Thy is finally discussed.
Figures


Similar articles
-
Generation of Level- k LGT Networks.IEEE/ACM Trans Comput Biol Bioinform. 2020 Jan-Feb;17(1):158-164. doi: 10.1109/TCBB.2019.2895344. Epub 2019 Jan 25. IEEE/ACM Trans Comput Biol Bioinform. 2020. PMID: 30703035
-
An alternative flavin-dependent mechanism for thymidylate synthesis.Science. 2002 Jul 5;297(5578):105-7. doi: 10.1126/science.1072113. Epub 2002 May 23. Science. 2002. PMID: 12029065
-
Probabilistic inference of lateral gene transfer events.BMC Bioinformatics. 2016 Nov 11;17(Suppl 14):431. doi: 10.1186/s12859-016-1268-2. BMC Bioinformatics. 2016. PMID: 28185583 Free PMC article.
-
Detecting lateral genetic transfer : a phylogenetic approach.Methods Mol Biol. 2008;452:457-69. doi: 10.1007/978-1-60327-159-2_21. Methods Mol Biol. 2008. PMID: 18566777 Review.
-
Phylogenomic networks.Trends Microbiol. 2011 Oct;19(10):483-91. doi: 10.1016/j.tim.2011.07.001. Epub 2011 Aug 3. Trends Microbiol. 2011. PMID: 21820313 Review.
Cited by
-
Functional Prokaryotic-Like Deoxycytidine Triphosphate Deaminases and Thymidylate Synthase in Eukaryotic Social Amoebae: Vertical, Endosymbiotic, or Horizontal Gene Transfer?Mol Biol Evol. 2023 Dec 1;40(12):msad268. doi: 10.1093/molbev/msad268. Mol Biol Evol. 2023. PMID: 38064674 Free PMC article.
-
Bacterial origins of thymidylate metabolism in Asgard archaea and Eukarya.Nat Commun. 2023 Feb 15;14(1):838. doi: 10.1038/s41467-023-36487-z. Nat Commun. 2023. PMID: 36792581 Free PMC article.
-
A Novel Phage Infecting Alteromonas Represents a Distinct Group of Siphophages Infecting Diverse Aquatic Copiotrophs.mSphere. 2021 Jun 30;6(3):e0045421. doi: 10.1128/mSphere.00454-21. Epub 2021 Jun 9. mSphere. 2021. PMID: 34106770 Free PMC article.
-
Protein Homeostasis Imposes a Barrier on Functional Integration of Horizontally Transferred Genes in Bacteria.PLoS Genet. 2015 Oct 20;11(10):e1005612. doi: 10.1371/journal.pgen.1005612. eCollection 2015 Oct. PLoS Genet. 2015. PMID: 26484862 Free PMC article.
-
Biased gene transfer in microbial evolution.Nat Rev Microbiol. 2011 Jun 13;9(7):543-55. doi: 10.1038/nrmicro2593. Nat Rev Microbiol. 2011. PMID: 21666709 Review.
References
-
- Ababneh F, Jermiin LS, Ma C, Robinson J. Matched-pairs tests of homogeneity with applications to homologous nucleotide sequences. Bioinformatics. 2006;22:1225–1231. - PubMed
-
- Abascal F, Zardoya R, Posada D. ProtTest: selection of best-fit models of protein evolution. Bioinformatics. 2005;21:2104–2105. - PubMed
-
- Altschul SF, Gish W, Miller W, Myers EW, Lipman DJ. Basic local alignment search tool. J. Mol. Biol. 1990;215:403–410. - PubMed
Publication types
MeSH terms
Substances
LinkOut - more resources
Full Text Sources
Research Materials

