Comparative Study
. 2010 Sep;11(9):1205-20.
doi: 10.1111/j.1600-0854.2010.01083.x. Epub 2010 May 26.

Comparison of FcRn- and pIgR-mediated transport in MDCK cells by fluorescence confocal microscopy

Affiliations
Free PMC article
Comparative Study

Comparison of FcRn- and pIgR-mediated transport in MDCK cells by fluorescence confocal microscopy

Galina V Jerdeva et al. Traffic. 2010 Sep.
Free PMC article

Abstract

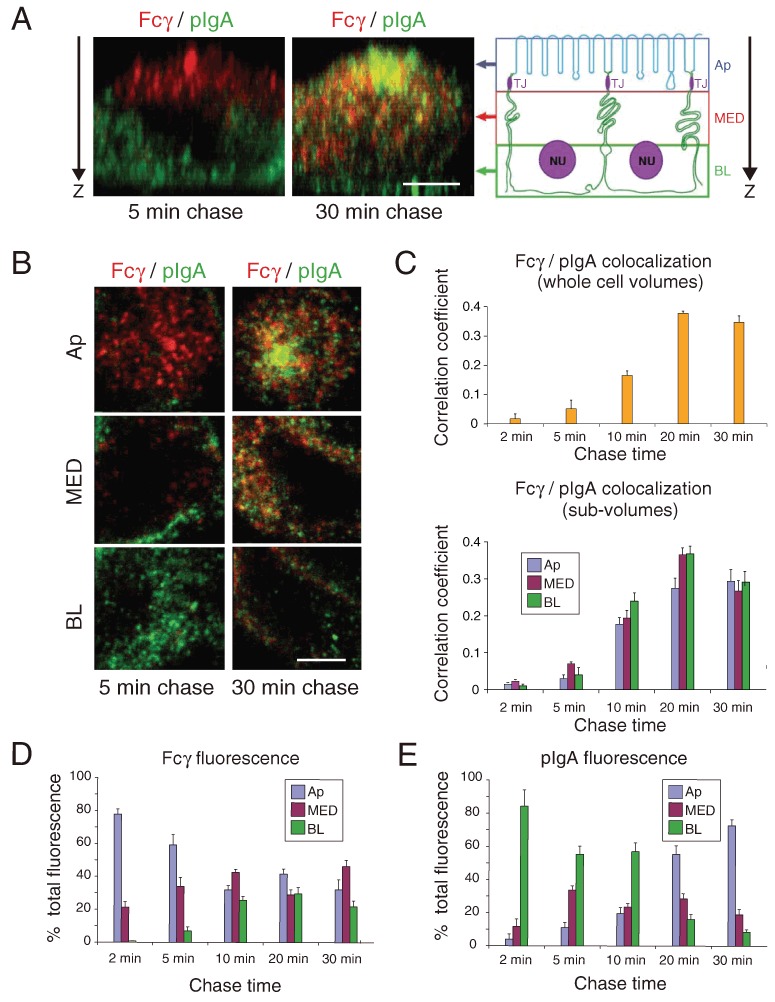
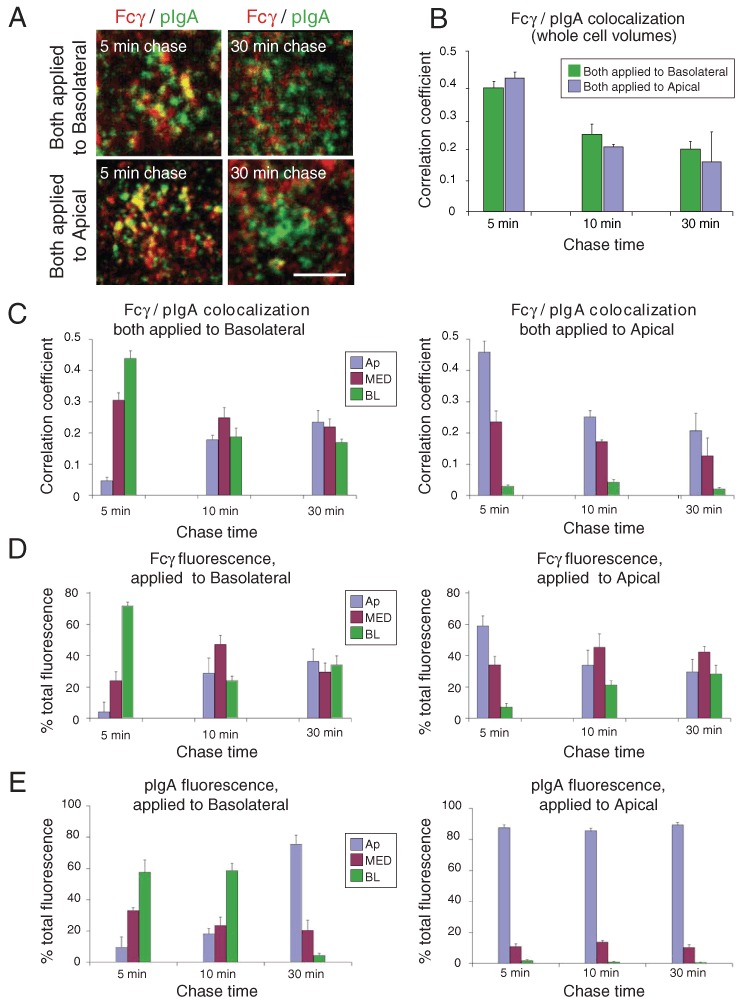
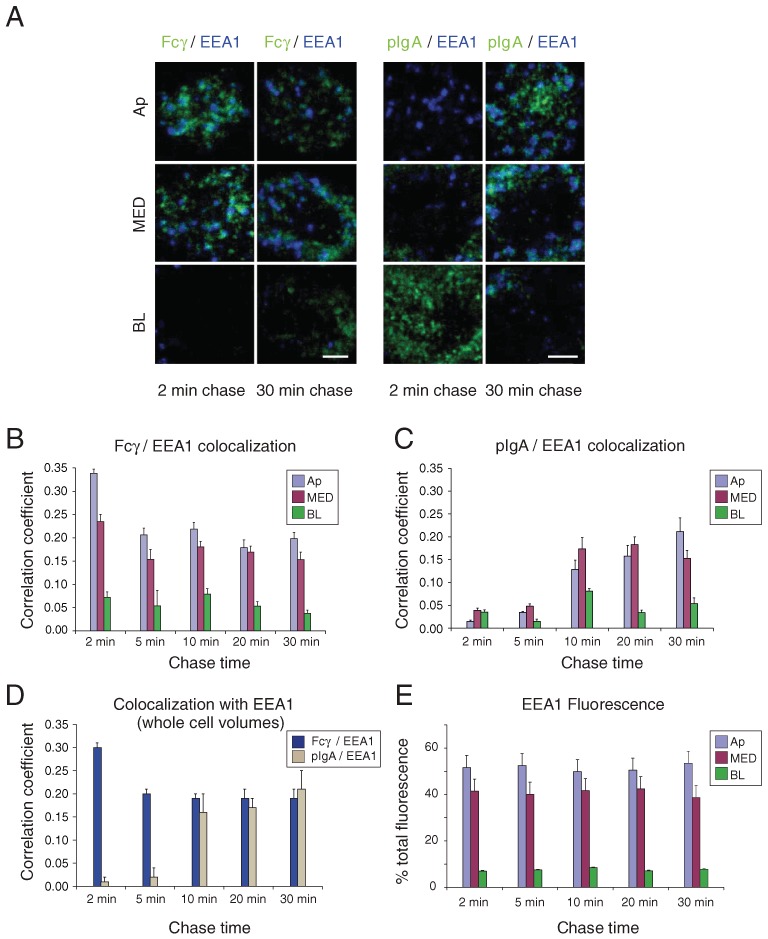
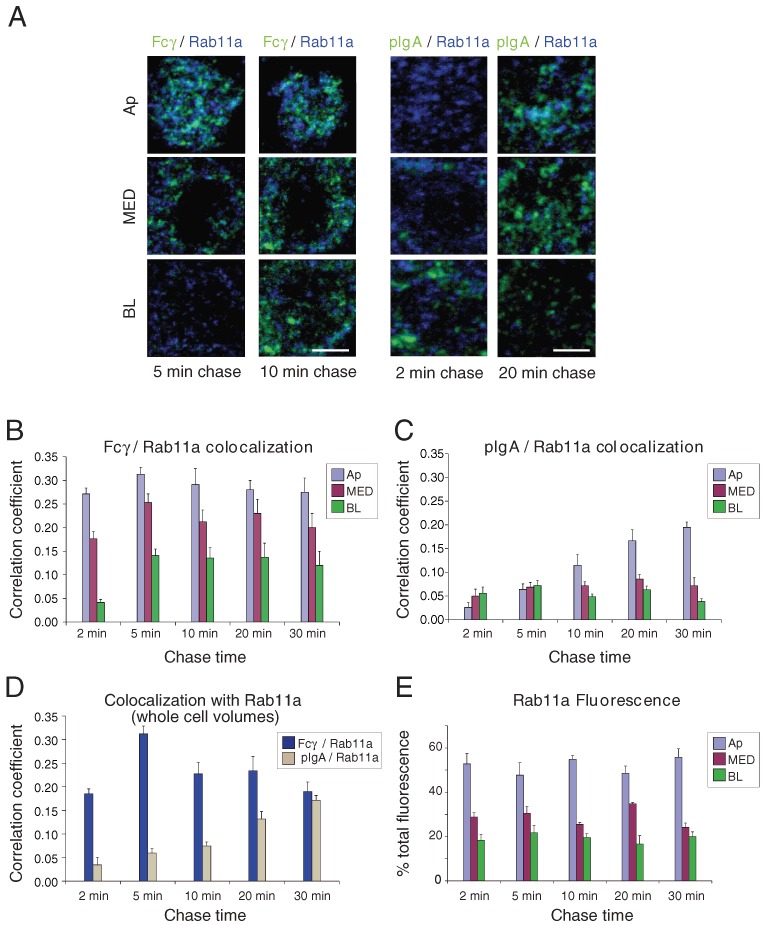
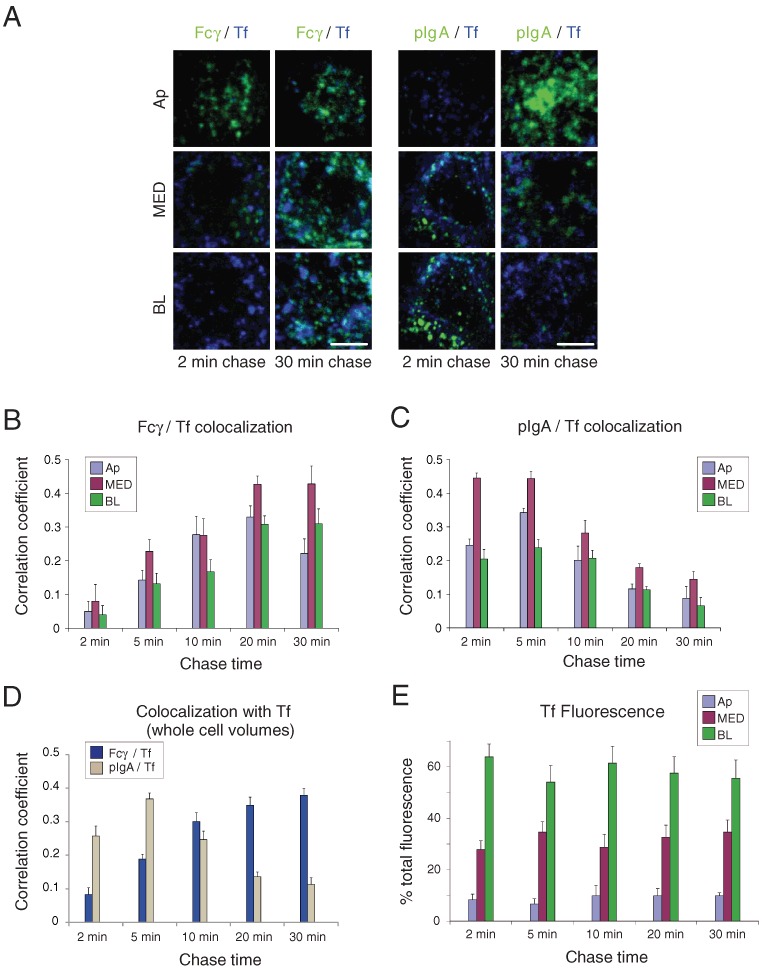
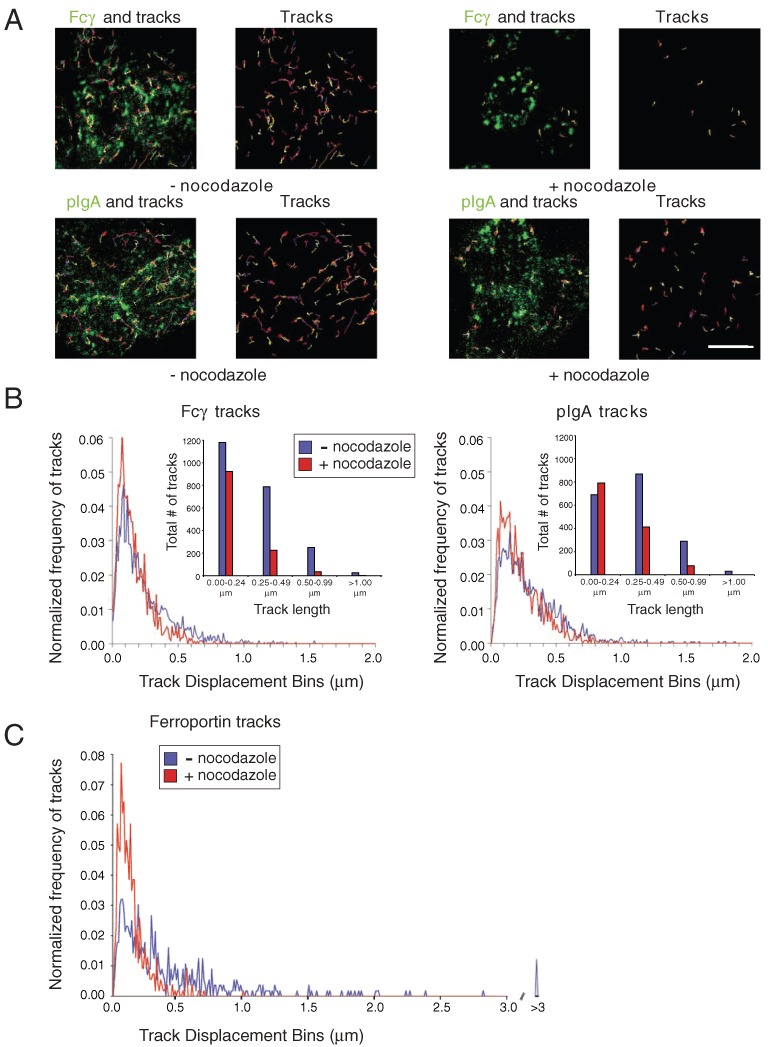
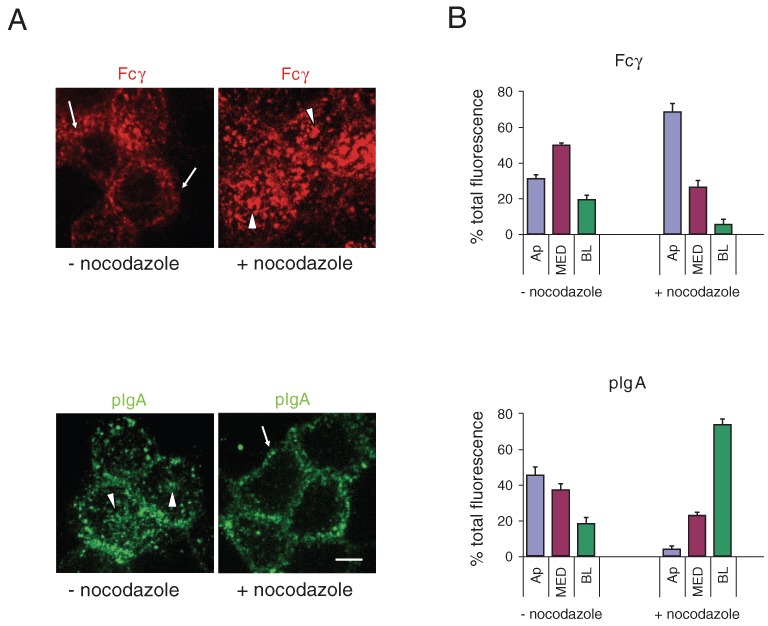
Protein delivery across polarized epithelia is controlled by receptor-mediated transcytosis. Many studies have examined basolateral-to-apical trafficking of polymeric IgA (pIgA) by the polymeric immunoglobulin receptor (pIgR). Less is known about apical-to-basolateral transcytosis, the direction the neonatal Fc receptor (FcRn) transports maternal IgGs across intestinal epithelia. To compare apical-to-basolateral and basolateral-to-apical transcytosis, we co-expressed FcRn and pIgR in Madin-Darby canine kidney (MDCK) cells and used pulse-chase experiments with confocal microscopy to examine transport of apically applied IgG Fcgamma and basolaterally applied pIgA. Fcgamma and pIgA trafficking routes were initially separate but intermixed at later chase times. Fcgamma was first localized near the apical surface, but became more equally distributed across the cell, consistent with concomitant transcytosis and recycling. By contrast, pIgA transport was strongly unidirectional: pIgA shifted from near the basolateral surface to an apical location with increasing time. Some Fcgamma and pIgA fluorescence colocalized in early (EEA1-positive), recycling (Rab11a-positive), and transferrin (Tf)-positive common/basolateral recycling endosomes. Fcgamma became more enriched in Tf-positive endosomes with time, whereas pIgA was sorted from these compartments. Live-cell imaging revealed that vesicles containing Fcgamma or pIgA shared similar mobility characteristics and were equivalently affected by depolymerizing microtubules, indicating that both trafficking routes depended to roughly the same extent on intact microtubules.


Figures

Figure 1
Figure 1
Colocalization of Fcγ and pIgA. AlexaFluor-568-labeled Fcγ (applied apically at pH 5.9) and AlexaFluor-488-labeled pIgA (applied basolaterally at pH 7.4) were incubated with FcRn-pIgR-MDCK cells for a short pulse and then chased for the indicated times. Fixed cells were examined by confocal microscopy as whole cell volumes [panels A and C (top)] or sub-volumes (panels B–E). Bars (A and B) = 2.5 µm. Quantitative 3-D colocalization analyses are presented as Pearson's correlation coefficients. Values in histograms represent the mean and standard error from measurements taken from 11 to 19 cells per condition. Calculated p-values for the statistical significance of differences between pairwise combinations in the histograms are presented in Table S1. (A) Left: Side-views of FcRn-pIgA-MDCK cells at indicated chase times showing Fcγ (red) and pIgA (green) fluorescence. Regions of colocalization appear yellow. Right: Schematic diagram to define three sub-volumes: apical (Ap), medial (MED) and basolateral (BL). (B) Confocal data from panel A displayed as sub-volumes projected down the apical-to-basolateral direction (Z-axis in panel A). (C) Quantitative analyses to compare Fcγ/pIgA colocalization as a function of chase time in whole cell volumes (top) or sub-volumes (bottom). (D) Percent of total Fcγ fluorescence in sub-volumes as a function of chase time. (E) Percent of total pIgA fluorescence in sub-volumes as a function of chase time.
Figure 2
Figure 2
Colocalization of Fcγ and pIgA when both applied to the same surface. AlexaFluor-568-labeled Fcγ and AlexaFluor-488-labeled pIgA were both incubated with either the apical surface or the basolateral surface of FcRn-pIgR-MDCK cells for a short pulse at pH 5.9 and then chased for the indicated times. Quantitative 3-D colocalization analyses are presented as Pearson's correlation coefficients. Values in histograms represent the mean and standard error from measurements taken from 11 to 19 cells per condition. Calculated p-values for the statistical significance of differences between pairwise combinations in the histograms are presented in Table S1. (A) Whole cell volume projections are shown with Fcγ fluorescence in red, pIgA fluorescence in green, and regions of colocalization in yellow. Bar = 2.5 µm. (B) Quantitative 3-D colocalization analysis to compare Fcγ/pIgA colocalization as a function of chase time in whole cell volumes when both ligands were applied to the basolateral or apical surface. (C) Quantitative 3-D colocalization analysis to compare Fcγ/pIgA colocalization as a function of chase time in sub-volumes when both ligands were applied to the basolateral (left) or apical (right) surface. (D) Percent of total Fcγ fluorescence in sub-volumes as a function of chase time when Fcγ was applied to the basolateral (left) or apical (right) surface. (E) Percent of total pIgA fluorescence in sub-volumes as a function of chase time when pIgA was applied to the basolateral (left) or apical (right) surface.
Figure 3
Figure 3
Colocalization of Fcγ and pIgA with EEA1. AlexaFluor-488-labeled Fcγ (applied apically at pH 5.9) or AlexaFluor-488-labeled pIgA (applied basolaterally at pH 7.4) was incubated with FcRn-MDCK or pIgR-MDCK cells for a short pulse and then chased for the indicated times. Fixed cells were prepared for immunofluorescence using an antibody against EEA1 and examined by confocal microscopy. Quantitative 3-D colocalization analyses are presented as Pearson's correlation coefficients. Values in histograms represent the mean and standard error from measurements taken from 11 to 19 cells per condition. Calculated p-values for the statistical significance of differences between pairwise combinations in the histograms are presented in Table S1. (A) Fcγ or pIgA fluorescence (green) is shown with EEA1 fluorescence (blue) in the indicated sub-volumes. Regions of colocalization appear in cyan. Bar = 2.5 µm. (B) Quantitative 3-D analysis of Fcγ/EEA1 colocalization as a function of chase time in sub-volumes. (C) Quantitative 3-D analysis of pIgA/EEA1 colocalization as a function of chase time in sub-volumes. (D) Quantitative 3-D analysis of Fcγ/EEA1 and pIgA/EEA1 colocalization as a function of chase time in whole cell volumes. (E) Percent of total EEA1 fluorescence in sub-volumes as a function of chase time.
Figure 4
Figure 4
Colocalization of Fcγ and pIgA with Rab11a. AlexaFluor-488-labeled Fcγ (applied apically at pH 5.9) or AlexaFluor-488-labeled pIgA (applied basolaterally at pH 7.4) was incubated with FcRn-MDCK or pIgR-MDCK cells for a short pulse and then chased for the indicated times. Fixed cells were prepared for immunofluorescence using an antibody against Rab11a and examined by confocal microscopy. Quantitative 3-D colocalization analyses are presented as Pearson's correlation coefficients. Values in histograms represent the mean and standard error from measurements taken from 11 to 19 cells per condition. Calculated p-values for the statistical significance of differences between pairwise combinations in the histograms are presented in Table S1. (A) Fcγ or pIgA fluorescence (green) is shown with Rab11a fluorescence (blue) in the indicated sub-volumes. Regions of colocalization appear in cyan. Bar = 2.5 µm. (B) Quantitative 3-D analysis of Fcγ/Rab11a colocalization as a function of chase time in sub-volumes. (C) Quantitative 3-D analysis of pIgA/Rab11a colocalization as a function of chase time in sub-volumes. (D) Quantitative 3-D analysis of Fcγ/Rab11a and pIgA/Rab11a colocalization as a function of chase time in whole cell volumes. (E) Percent of total Rab11a fluorescence in sub-volumes as a function of chase time.
Figure 5
Figure 5
Colocalization of Fcγ and pIgA with Tf. AlexaFluor-488-labeled Fcγ (applied apically at pH 5.9) or AlexaFluor-488-labeled pIgA (applied basolaterally at pH 7.4 together with AlexaFluor-568- or -647-labeled Tf) was incubated with FcRn-MDCK or pIgR-MDCK cells for a short pulse and then chased for the indicated times. Cells were fixed and examined by confocal microscopy. Quantitative 3-D colocalization analyses are presented as Pearson's correlation coefficients. Values in histograms represent the mean and standard error from measurements taken from 11 to 19 cells per condition. Calculated p-values for the statistical significance of differences between pairwise combinations in the histograms are presented in Table S1. (A) Fcγ or pIgA fluorescence (green) is shown with Tf fluorescence (blue) in the indicated sub-volumes. Regions of colocalization appear in cyan. Bar = 2.5 µm. (B) Quantitative 3-D analysis of Fcγ/Tf colocalization as a function of chase time in sub-volumes. (C) Quantitative 3-D analysis of pIgA/Tf colocalization as a function of chase time in sub-volumes. (D) Quantitative 3-D analysis of Fcγ/Tf and pIgA/Tf colocalization as a function of chase time in whole cell volumes. (E) Percent of total Tf fluorescence in sub-volumes as a function of chase time.
Figure 6
Figure 6
Effects of nocodazole on the dynamics of Fcγ and pIgA-containing vesicles. FcRn-MDCK or pIgR-MDCK cells were pretreated for 1 h with nocodazole-containing media or control media at 4°C. AlexaFluor-488-labeled Fcγ (applied apically at pH 5.9) or AlexaFluor-488-labeled pIgA (applied basolaterally at pH 7.4) was added to each condition and the incubation was continued for 10 min. Cells were imaged live after washing in the presence or absence of nocodazole. (A) Tracks (≥0.5 µm only) throughout a 30-second time-course were overlaid on the representative images or shown alone. Bar = 5 µm. (B) Normalized track displacements for Fcγ- and pIgA-positive tracked vesicles in untreated (blue) and nocodazole-treated (red) cells presented as histograms. Insets: binned data showing the total number of tracks in each of the four length categories. Note that there were 1.5- to 1.9-fold more trackable vesicles in the untreated samples compared to the nocodazole-treated samples (see Methods). (C) Normalized track displacements for ferroportin-positive tracked vesicles in untreated (blue) and nocodazole-treated (red) cells (similar to Figure 8b in ref , but presenting data for a 30-second time-course to correspond to time-courses in panel B).
Figure 7
Figure 7
Effects of nocodazole on the distribution of Fcγ and pIgA. FcRn-MDCK or pIgR-MDCK cells were pretreated for 1 h with nocodazole-containing media or control media at 4°C. AlexaFluor-568-labeled Fcγ (applied apically at pH 5.9) or AlexaFluor-488-labeled pIgA (applied basolaterally at pH 7.4) was added to each condition and the incubation was continued for 20 min. Cells were fixed and examined by confocal microscopy. (A) Whole cell volume projection images. Arrowheads indicate apical staining; arrows indicate basolateral staining. Bar = 5 µm. (B) Percent of total Fcγ and pIgA fluorescence in sub-volumes of control and nocodazole-treated cells.

Similar articles

Cited by

References

    1. Simons K, Fuller SD. Cell surface polarity in epithelia. Annu Rev Cell Biol. 1985;1:243–288. - PubMed
    1. Cereijido M, Ponce A, Gonzalezmariscal L. Tight junctions and apical basolateral polarity. J Membr Biol. 1989;110:1–9.
    1. Mostov KE. Transepithelial transport of immunoglobulins. Ann Rev Immunol. 1994;12:63–84. - PubMed
    1. Brandtzaeg P, Prydz H. Direct evidence for an integrated function of J-chain and secretory component in epithelial transport of immunoglobulins. Nature. 1984;311:71–74. - PubMed
    1. Radl J, Klein F, Van Den Berg P, De Bruyn AM, Hijmans W. Binding of secretory piece to polymeric IgA and IgM paraproteins in vitro. Immunology. 1971;20:843–852. - PMC - PubMed

Publication types

LinkOut - more resources