Archaic chaos: intrinsically disordered proteins in Archaea
- PMID: 20522251
- PMCID: PMC2880407
- DOI: 10.1186/1752-0509-4-S1-S1
Archaic chaos: intrinsically disordered proteins in Archaea
Abstract
Background: Many proteins or their regions known as intrinsically disordered proteins (IDPs) and intrinsically disordered regions (IDRs) lack unique 3D structure in their native states under physiological conditions yet fulfill key biological functions. Earlier bioinformatics studies showed that IDPs and IDRs are highly abundant in different proteomes and carry out mostly regulatory functions related to molecular recognition and signal transduction. Archaea belong to an intriguing domain of life whose members, being microbes, are characterized by a unique mosaic-like combination of bacterial and eukaryotic properties and include inhabitants of some of the most extreme environments on the planet. With the expansion of the archaea genome data (more than fifty archaea species from five different phyla are known now), and with recent improvements in the accuracy of intrinsic disorder prediction, it is time to re-examine the abundance of IDPs and IDRs in the archaea domain.
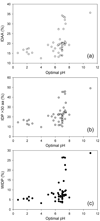
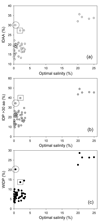
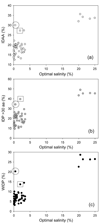
Results: The abundance of IDPs and IDRs in 53 archaea species is analyzed. The amino acid composition profiles of these species are generally quite different from each other. The disordered content is highly species-dependent. Thermoproteales proteomes have 14% of disordered residues, while in Halobacteria, this value increases to 34%. In proteomes of these two phyla, proteins containing long disordered regions account for 12% and 46%, whereas 4% and 26% their proteins are wholly disordered. These three measures of disorder content are linearly correlated with each other at the genome level. There is a weak correlation between the environmental factors (such as salinity, pH and temperature of the habitats) and the abundance of intrinsic disorder in Archaea, with various environmental factors possessing different disorder-promoting strengths. Harsh environmental conditions, especially those combining several hostile factors, clearly favor increased disorder content. Intrinsic disorder is highly abundant in functional Pfam domains of the archaea origin. The analysis based on the disordered content and phylogenetic tree indicated diverse evolution of intrinsic disorder among various classes and species of Archaea.
Conclusions: Archaea proteins are rich in intrinsic disorder. Some of these IDPs and IDRs likely evolve to help archaea to accommodate to their hostile habitats. Other archaean IDPs and IDRs possess crucial biological functions similar to those of the bacterial and eukaryotic IDPs/IDRs.
Figures




Similar articles
-
Structural disorder of plasmid-encoded proteins in Bacteria and Archaea.BMC Bioinformatics. 2018 Apr 25;19(1):158. doi: 10.1186/s12859-018-2158-6. BMC Bioinformatics. 2018. PMID: 29699482 Free PMC article.
-
Comprehensive Intrinsic Disorder Analysis of 6108 Viral Proteomes: From the Extent of Intrinsic Disorder Penetrance to Functional Annotation of Disordered Viral Proteins.J Proteome Res. 2021 May 7;20(5):2704-2713. doi: 10.1021/acs.jproteome.1c00011. Epub 2021 Mar 10. J Proteome Res. 2021. PMID: 33719450
-
Unfoldomics of human diseases: linking protein intrinsic disorder with diseases.BMC Genomics. 2009 Jul 7;10 Suppl 1(Suppl 1):S7. doi: 10.1186/1471-2164-10-S1-S7. BMC Genomics. 2009. PMID: 19594884 Free PMC article.
-
Functional unfoldomics: Roles of intrinsic disorder in protein (multi)functionality.Adv Protein Chem Struct Biol. 2024;138:179-210. doi: 10.1016/bs.apcsb.2023.11.001. Epub 2023 Nov 22. Adv Protein Chem Struct Biol. 2024. PMID: 38220424 Review.
-
Features of molecular recognition of intrinsically disordered proteins via coupled folding and binding.Protein Sci. 2019 Nov;28(11):1952-1965. doi: 10.1002/pro.3718. Epub 2019 Sep 4. Protein Sci. 2019. PMID: 31441158 Free PMC article. Review.
Cited by
-
Intrinsically disordered regions of p53 family are highly diversified in evolution.Biochim Biophys Acta. 2013 Apr;1834(4):725-38. doi: 10.1016/j.bbapap.2013.01.012. Epub 2013 Jan 22. Biochim Biophys Acta. 2013. PMID: 23352836 Free PMC article.
-
DBC1/CCAR2 and CCAR1 Are Largely Disordered Proteins that Have Evolved from One Common Ancestor.Biomed Res Int. 2014;2014:418458. doi: 10.1155/2014/418458. Epub 2014 Dec 11. Biomed Res Int. 2014. PMID: 25610865 Free PMC article.
-
2K09 and thereafter : the coming era of integrative bioinformatics, systems biology and intelligent computing for functional genomics and personalized medicine research.BMC Genomics. 2010 Dec 1;11 Suppl 3(Suppl 3):I1. doi: 10.1186/1471-2164-11-S3-I1. BMC Genomics. 2010. PMID: 21143775 Free PMC article.
-
Intrinsic disorder in biomarkers of insulin resistance, hypoadiponectinemia, and endothelial dysfunction among the type 2 diabetic patients.Intrinsically Disord Proteins. 2016 May 11;4(1):e1171278. doi: 10.1080/21690707.2016.1171278. eCollection 2016. Intrinsically Disord Proteins. 2016. PMID: 28232897 Free PMC article.
-
Networks of Networks: An Essay on Multi-Level Biological Organization.Front Genet. 2021 Jun 21;12:706260. doi: 10.3389/fgene.2021.706260. eCollection 2021. Front Genet. 2021. PMID: 34234818 Free PMC article. Review.
References
Publication types
MeSH terms
Substances
Grants and funding
LinkOut - more resources
Full Text Sources

