. 2010 Jul 1;185(1):313-26.
doi: 10.4049/jimmunol.0904023. Epub 2010 Jun 2.

In vivo regulation of Bcl6 and T follicular helper cell development

Affiliations

In vivo regulation of Bcl6 and T follicular helper cell development

Amanda C Poholek et al. J Immunol. .

Abstract

Follicular helper T (T(FH)) cells, defined by expression of the surface markers CXCR5 and programmed death receptor-1 (PD-1) and synthesis of IL-21, require upregulation of the transcriptional repressor Bcl6 for their development and function in B cell maturation in germinal centers. We have explored the role of B cells and the cytokines IL-6 and IL-21 in the in vivo regulation of Bcl6 expression and T(FH) cell development. We found that T(FH) cells are characterized by a Bcl6-dependent downregulation of P-selectin glycoprotein ligand 1 (PSGL1, a CCL19- and CCL21-binding protein), indicating that, like CXCR5 and PD-1 upregulation, modulation of PSGL1 expression is part of the T(FH) cell program of differentiation. B cells were neither required for initial upregulation of Bcl6 nor PSGL1 downregulation, suggesting these events preceded T-B cell interactions, although they were required for full development of the T(FH) cell phenotype, including CXCR5 and PD-1 upregulation, and IL-21 synthesis. Bcl6 upregulation and T(FH) cell differentiation were independent of IL-6 and IL-21, revealing that either cytokine is not absolutely required for development of Bcl6(+) T(FH) cells in vivo. These data increase our understanding of Bcl6 regulation in T(FH) cells and their differentiation in vivo and identifies a new surface marker that may be functionally relevant in this subset.


Figures
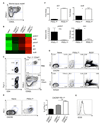
Figure 1
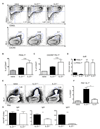
Figure 1. PSGL1 is downregulated on TFH cells
(A) Expression of PSGL1 and CD62L on CD4+ CD44hi B220lo splenocytes in aged lupus-prone MRL/Faslpr mice. (B) Selected genes are differentially expressed in CD4 PSGL1lo T cells from lupus-prone MRL/Faslpr mice. (C) Expression of PSGL1 and CD62L on transferred OT-II Thy1.1 CD4 T cells in unimmunized or immunized mice. Left panels are gated on CD4+ B220lo cells. (D) Expression of CXCR5 and PD-1 on gated OT-II Thy1.1 CD4 T cells 6 days after transfer to B6 mice and immunization. Bar graph represents the percentage of cells that are CXCR5hi PD-1hi of indicated group. Results are representative of 3 independent experiments using 4 mice per group. **p = 0.0075 (E) Expression of ICOS on OT-II Thy1.1 CD4 T cells 6 days after transfer to B6 mice and immunization. Naïve CD4 T cells are shown in grey shade, and PSGL1lo T cells by the black line. (F) Expression of il21, bcl6, prdm1, and rorc transcripts in sorted PSGL1hi and PSGL1lo OT-II Thy1.1 CD4 T cells 6 days after transfer to B6 mice and immunization with OVA in alum. Results are representative of 3 independent experiments. Fold change is in comparison to sorted naïve CD4 T cells; il21, **p = 0.0012, bcl6, *p = 0.0223, and rorc, *p = 0.0221. (G) Expression of CXCR4 on naïve, PSGL1lo TFH, and B220+ cells 7 days after transfer to B6 mice and immunization. The PSGL1lo cells are in the gated OT-II Thy1.1 CD4 T cell population. Results are representative of 2 experiments using 4 mice per experiment.
Figure 2
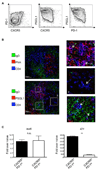
Figure 2. PSGL1lo TFH cells are located in GCs and express Bcl6
(A) Expression of CXCR5, PD-1, and PSGL1 on CD44hi CD4 T cells taken from spleens of B6 mice 8 days after immunization with NP-CGG in alum. (B) Microscopy of spleens taken from B6 mice 8 days after immunization with NP-CGG in alum. Sections were stained with 4 antibodies. For simplicity, the top panel shows staining to detect IgD, PNA, and CD4; the bottom panel shows that for IgD, PSGL1, and CD4. Inset panels (1–3) show increased magnification of labeled areas. Arrows indicate PSGL1hi (panel 1) or PSGL1lo (panels 2 and 3) CD4 T cells. (C) Expression of bcl6 and il21 mRNA levels in sorted CD44hi CD4+ PSGL1lo CXCR5lo PD-1lo or CD44hi CD4+ PSGL1lo CXCR5hi PD-1hi cell subsets. Results are representative of 2 independent experiments. Fold change is in comparison to sorted naïve CD4 T cells. p values: bcl6, p = 0.8765, il21, **p = 0.0016.
Figure 3
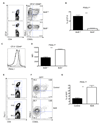
Figure 3. Bcl6 is required for downregulation of PSGL1
(A) Expansion of adoptively transferred OT-II CD4 T cells (left panels) and expression of CD62L and PSGL1 on transferred CD44hi Bcl6+/+ or Bcl6−/− CD4 T cells (right panels) following immunization of recipient mice. (B) Percentage of PSGL1lo CD4 T cells among total transferred T cells, representative of the data shown in (A), compiled from 3 independent experiments using 4 mice per group. ***p < 0.0001. (C) Mean fluorescence intensity of PSGL1 on transferred OT-II+ Bcl6+/+ or Bcl6−/− CD4 T cells following immunization of recipient mice with OVA in alum. Naïve CD4 T cells represented by shaded grey, OT-II CD44hi Bcl6+/+ CD4 T cells by the dashed line, and OT-II CD44hi Bcl6−/− CD4 T cells by the solid line. (D) MFI of PSGL1 gated on OT-II CD44hi PSGL1hi CD4 T cells. Bar graph is representative of 3 independent experiments, using 4 mice for each group. *** p < 0.0001. (E) Expansion of OT-II Thy1.1 CD4 T cells transduced with a GFP-expressing retrovirus 6 days after transfer to B6 mice and immunization with OVA in alum. (F) Expression of CD62L and PSGL1 on OT-II Thy1.1 GFP+ CD44hi CD4 T cells 6 days after transfer to B6 mice and immunization. (G) Percentages of PSGL1lo cells of total transferred OT-II GFP+ CD4 T cells, with results representative of the data in (E) and of 3 independent experiments using 3 mice for each group. **p = 0.0061.
Figure 4
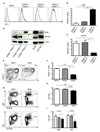
Figure 4. Bcl6 is required for development of extrafollicular helper T cells and formation of IgG-producing plasma cells in MRL/Faslpr mice
(A) Expression of PD-1 on naïve, CD62Lhi PSGL1hi, CD62Llo PSGL1hi, and CD62Llo PSGL1lo cells from MRL/Faslpr mice. Grey shaded is isotype control, black line is PD-1. (B & C) Expression of bcl6 and prdm1 (Blimp1) transcripts in sorted CD62Lhi PSGL1hi, CD62Llo PSGL1hi, and CD62Llo PSGL1lo cells isolated from spleens of 12–16 week old MRL/Faslpr mice. Results are representative of 3 experiments. In (B), **p = 0.0029 (comparing CD62Llo PSGL1hi and CD62Llo PSGL1lo cells), **p = 0.0093 (CD62Lhi PSGL1hi vs. CD62Llo PSGL1lo), and in (C), *p = 0.0427 (CD62Llo PSGL1hi vs. CD62Llo PSGL1lo), *p = 0.0391 (CD62Lhi PSGL1hi vs. CD62Llo PSGL1lo). (D) Protein expression of Bcl6 and Blimp1 in sorted CD62Lhi PSGL1hi, CD62Llo PSGL1hi, and CD62Llo PSGL1lo cells isolated from spleens of 12–16 week old MRL/Faslpr mice. The human B cell line BJAB was used as a positive control for Bcl6 and purified B cells activated in vitro with LPS for 48 hours served as a positive control for Blimp1. Actin was used as a loading control. Results are representative of 2 experiments. (E & F) Spleens from 7–8 week old Bcl6-intact or -deficient MRL/Faslpr mice were analyzed for the presence of PSGL1lo cells. Results are representative of 3 independent experiments from 3 cohorts of mice, with 4–5 mice per group. ***p < 0.0001 (Bcl6+/+ vs. Bcl6−/−), **p = 0.0038 (Bcl6+/− vs. Bcl6−/−). (G – I) Percentage and number of CD138+ plasma cells analyzed for intracellular expression of IgM and IgG isolated from spleens of 7–8 week-old Bcl6-intact or -deficient MRL/Faslpr mice. In (I), open bars represent Bcl6+/+, grey bars represent Bcl6+/− and black bars represent Bcl6−/− MRL/Faslpr mice. Results are representative of 3 independent experiments from 3 cohorts of mice, with 4–5 mice per group. In (H), p = 0.1497 (Bcl6+/+ vs. Bcl6−/−), p = 0.0817 (Bcl6+/− vs. Bcl6−/−). In (I), IgM p = 0.1591 (Bcl6+/+ vs. Bcl6−/−), *p = 0.0491 (Bcl6+/− vs. Bcl6−/−); IgG, p = 0.1209 (Bcl6+/+ vs. Bcl6−/−), *p = 0.0285 (Bcl6+/− vs. Bcl6−/−).
Figure 5
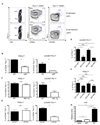
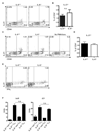
Figure 5. B cells are required for development of CXCR5hi PD-1hi TFH cells, but not downregulation of PSGL1
(A) Expansion of OT-II Thy1.1 CD4 T cells 6 days after adoptive transfer and immunization of recipient B6 mice with OVA in alum in the presence or absence of B cells (left panels). Expression of CD62L and PSGL1 (middle panels), and PD-1 and CXCR5 (right panels) on the expanded OT-II Thy1.1 CD44hi CD4 T cells in B cell-intact or –deficient recipients. (B) Percentages of TFH cells of OT-II Thy1.1 CD44hi CD4 T cells taken from B cell-intact and – deficient mice are shown, with **p = 0.0049 (PSGL1lo T cells) and **p = 0.0093 (CXCR5hi PD-1hi T cells). Data shown are representative of that in (A), and of 4 independent experiments, using 4 mice per group. (C) Percentages of TFH cells of OT-II Thy1.1 CD44hi CD4 T cells taken from HEL Ig transgenic (MD4), followed by immunization of recipient B6 mice, *p = 0.4702 (PSGL1lo T cells) and *p = 0.0370 (CXCR5hi PD-1hi T cells). Data are representative of 2 independent experiments using 4 mice per group. (D) Percentages of TFH cells of OT-II Thy1.1 CD44hi CD4 T cells 7 days after immunization of CD19-intact or -deficient recipients with OVA in alum. Bar graph shows data representative of 2 independent experiments using 4 mice per group. p = 0.7029 (PSGL1lo cells), **p = 0.0036 (CXCR5hi PD-1hi cells). (E) Percentages of CXCR5hi PD-1hi cells of OT-II Thy1.1 CD44hi cells 3 days after transfer (7 days after immunization) from B cell-intact or B cell-deficient mice. Bar graph shows data representative of 3 independent experiments using 2–3 mice per group. *p = 0.0129 (WT→WT vs. KO→KO), p = 0.6576 (WT→WT vs. KO→ WT), *p = 0.0354 (WT→WT vs. WT→KO), *p = 0.0218 (KO→WT vs. KO→KO). (F) Percentages of PSGL1lo cells of OT-II Thy1.1 CD44hi cells 3 days after transfer (7 days after immunization) to B cell-intact or B cell-deficient mice. Bar graph shows data representative of 3 independent experiments, using 2–3 mice per group. p = 0.4327 (WT→ WT vs. KO→KO), p = 0.8822 (WT→WT vs. KO→WT), p= 0.3921 (WT→WT vs. WT→KO), p = 0.3920 (KO→WT vs. KO→KO). (G) Expression of bcl6 mRNA in naïve CD4 T cells, and OT-II Thy1.1 CD44hi T cells sorted 7 days after transfer to B6 wild type (WT) or B cell-deficient (uMT) hosts, followed by immunization with OVA in alum. *p = 0.0112, transfer to naïve vs. WT recipients; *p= 0.0138, transfer to WT vs. uMT recipients; *p= 0.0163, transfer to naïve vs. uMT recipients. Data are representative of 3 independent experiments.
Figure 6
Figure 6. IL-21 is not required for development of TFH cells or Bcl6 upregulation in vivo
(A) Development of TFH cells in IL-21-intact or -deficient mice 7 days after immunization with NP-CGG in alum compared to unimmunized (naïve) mice, using PSGL1 (left panels) or CXCR5 and PD-1 (right panels) as markers. (B) Percentages of PSGL1lo T cells of CD44hi CD4 cells 7 days after immunization with NP-CGG in alum or in unimmunized (naïve) mice. Bar graph shows data representative of that revealed in the left panels of (A), compiled from 2 independent experiments, using 5 mice per group. p = 0.0959. (C) Percentages of CXCR5hi PD-1hi T cells of CD44hi CD4 cells 7 days after immunization with NP-CGG in alum or in unimmunized (naïve) mice. Data represented in the right panels of (A) are compiled from 2 independent experiments using 5 mice per group. p= 0.1044 (D) Bcl6 expression in CD4 CD44hi cells sorted into PSGL1hi and PSGL1lo subsets 7 days after immunization of IL-21-intact and –deficient mice with NP-CGG in alum. Expression is shown as fold over sorted naïve CD4 T cells. Data are representative of 2 independent experiments. (E) Analysis of GC cell formation (GL-7+ PNA+) in IL-21-intact, -deficient or unimmunized (naïve) mice. TCRβ IgD cells were gated. (F) Percentage of GC B cells (GL-7+ PNA+) among B220+ cells. Data shown are representative of that shown in (E), and of 2 independent experiments using 4 mice per group. **p = 0.0011. (G) Levels of anti-NP antibodies in the serum of IL-21-intact or -deficient mice bled 10 days after immunization with NP-GCC in alum. IgM, p = 0.8110; total IgG, **p = 0.0043; IgG1, ***p < 0.0001. Data compiled from one experiment, 5 mice per group.
Figure 7
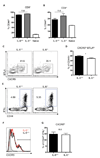
Figure 7. IL-6 is not required for development of TFH cells following infection with LCMV
(A&B) Expansion of activated (CD44hi CD62L) CD8 (A) and CD4 (B) T cells from spleens of IL-6-intact and -deficient mice isolated 8 days after LCMV infection. (C) Expression of BTLA and CXCR5 on CD44hi CD4 T cells 8 days after LCMV challenge in IL-6-intact or -deficient mice. (D) Percentages of TFH cells among CD44hi CD4 T cells 8 days after LCMV challenge in IL-6-intact or -deficient mice. Data are compiled from 3 independent experiments, using 9 mice per group. *p=0.0441. (E) Intracellular staining for IFNγ production in CD4 T cells from spleens isolated 8 days after LCMV infection in IL-6-intact or -deficient mice. Cells were re-stimulated with LCMV I-Ab binding peptide gp61-80 for 5 hours in vitro. (F) Expression of CXCR5 on LCMV-specific (CD44hi IFNγ+) CD4 T cells. Gray shaded line represents naïve CD4 T cells; black line represents CD44hi IFNγ + CD4 T cells from IL-6 intact mice; and red line represents CD44hi IFNγ + CD4 T cells from IL-6-deficient mice. (G) Percentages of TFH cells of LCMV-specific (IFNγ+) CD4 T cells 8 days after LCMV infection in IL-6-intact or -deficient mice. Data are compiled from 2 independent experiments, using 9 mice per group.
Figure 8
Figure 8. IL-6 is not required for Bcl6 expression or IL-21 production in TFH cells following infection with LCMV
(A) Intracellular staining of IL-21 in LCMV-specific CD4 T cells from spleens isolated 8 days after infection in IL-6-intact or -deficient mice. Cells were re-stimulated with LCMV I-Ab binding peptide gp61-80 for 5 hours in vitro. (B) Percentages of IL-21+ cells of LCMV-specific CD4 T cells. Data are compiled from 2 independent experiments, using 9 mice per group. (C, D, & E) IL-21 and IFNγ production by LCMV-specific CD44hi CD4 T cells assessed using intracellular staining after re-stimulation with PMA and ionomycin. Data are compiled from 2 independent experiments, using 9 mice per group. (F) Expression of bcl6 and il21 in TFH cells (CD4+CD44hiCXCR5hiBTLAhi) and non-TFH (CD4+CD44hiCXCR5loBTLAlo) cells sorted 8 days post-infection of IL-6-intact or -deficient mice.
Figure 9
Figure 9. IL-6 is not required for function of TFH cells during LCMV infection
(A) Analysis of GC formation (Fas+ GL7+) in spleens isolated 8 days after LCMV infection from IL-6-intact or -deficient mice. Cells are gated on B220+ B cells. (B) GC B cells as a percentage of total B220+ B cells from infected IL-6-intact or -deficient mice 8 days after LCMV infection. Data are compiled from 3 independent experiments, using 9 mice per group. (C & D) Titers of anti-LCMV IgG antibody in the serum of IL-6-intact or - deficient mice bled 8 and 15 days after LCMV infection. Day 8, **p < 0.001. Data are representative of 4 independent experiments.

Similar articles

Cited by

References

    1. Parker DC. T cell-dependent B cell activation. Annu Rev Immunol. 1993;11:331–360. - PubMed
    1. Garside P, Ingulli E, Merica RR, Johnson JG, Noelle RJ, Jenkins MK. Visualization of Specific B and T Lymphocyte Interactions in the Lymph Node. Science. 1998;281:96–99. - PubMed
    1. Breitfeld D, Ohl L, Kremmer E, Ellwart J, Sallusto F, Lipp M, Forster R. Follicular B helper T cells express CXC chemokine receptor 5, localize to B cell follicles, and support immunoglobulin production. J Exp Med. 2000;192:1545–1552. - PMC - PubMed
    1. Schaerli P, Willimann K, Lang AB, Lipp M, Loetscher P, Moser B. CXC chemokine receptor 5 expression defines follicular homing T cells with B cell helper function. J Exp Med. 2000;192:1553–1562. - PMC - PubMed
    1. Jacob J, Kelsoe G, Rajewsky K, Weiss U. Intraclonal generation of antibody mutants in germinal centres. Nature. 1991;354:389–392. - PubMed

Publication types

MeSH terms

Associated data