. 2010 May 28;38(4):487-99.
doi: 10.1016/j.molcel.2010.05.007.

Glucose addiction of TSC null cells is caused by failed mTORC1-dependent balancing of metabolic demand with supply

Affiliations

Glucose addiction of TSC null cells is caused by failed mTORC1-dependent balancing of metabolic demand with supply

Andrew Y Choo et al. Mol Cell. .

Abstract

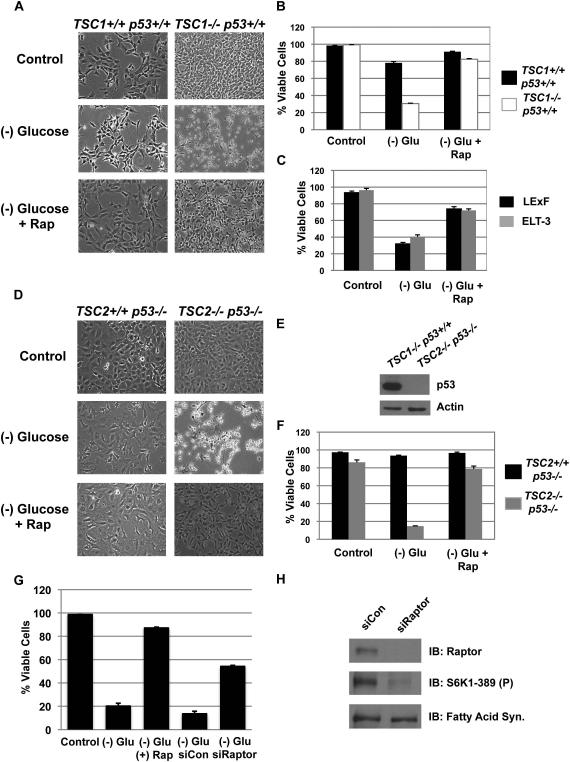
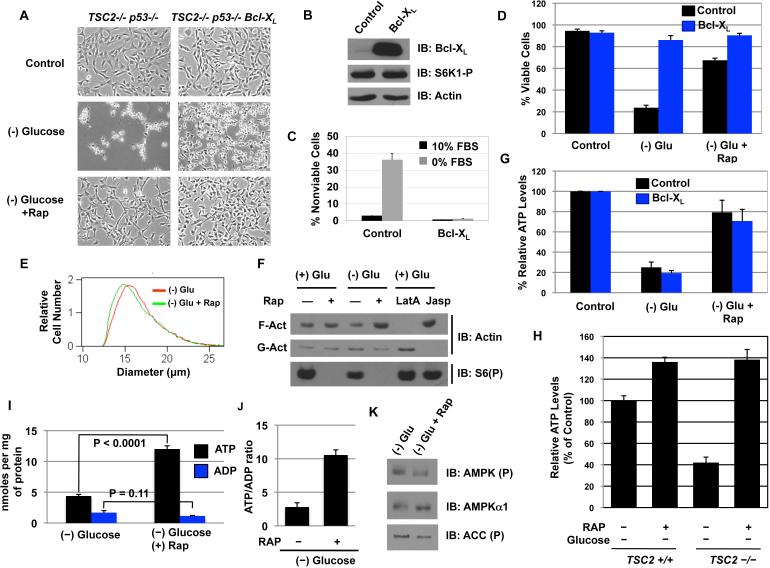
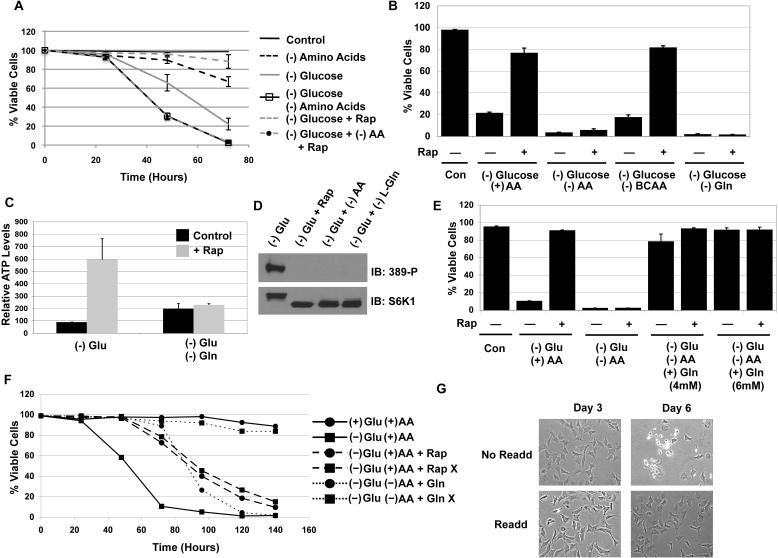
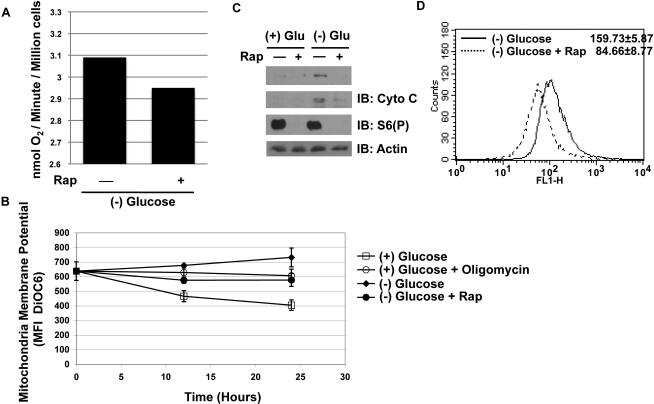
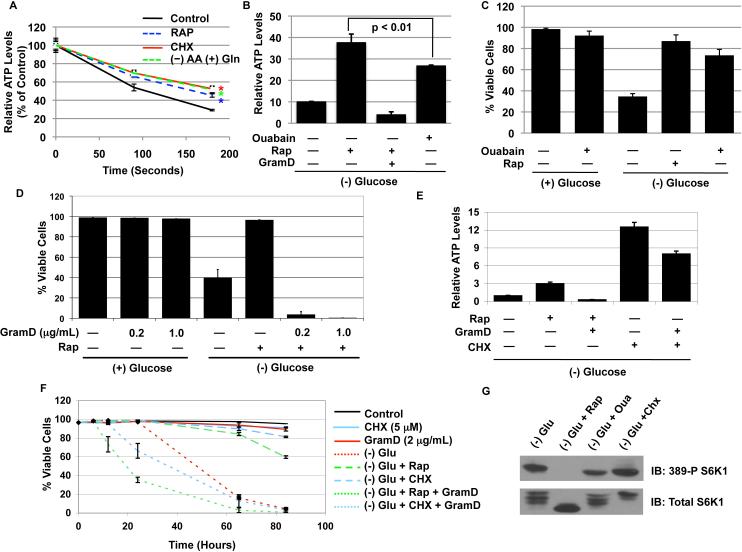
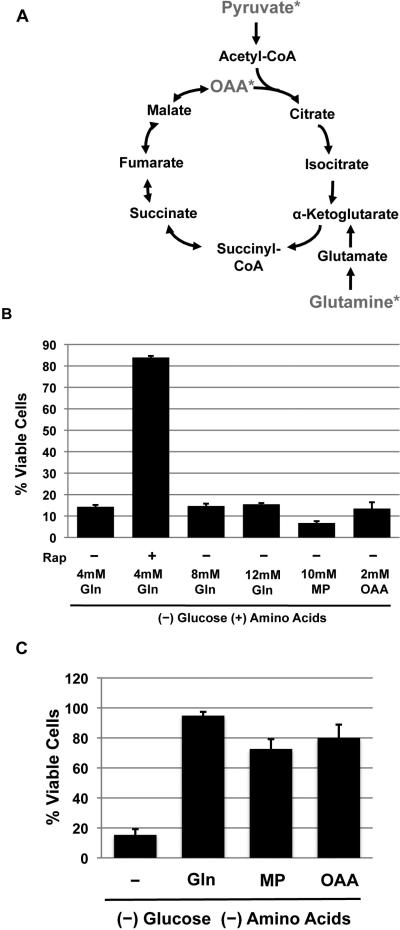
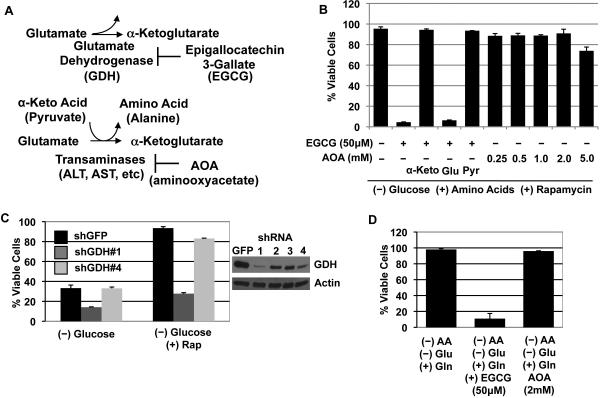
The mTORC1-signaling pathway integrates environmental conditions into distinct signals for cell growth by balancing anabolic and catabolic processes. Accordingly, energetic stress inhibits mTORC1 signaling predominantly through AMPK-dependent activation of TSC1/2. Thus, TSC1/2-/- cells are hypersensitive to glucose deprivation, and this has been linked to increased p53 translation and activation of apoptosis. Herein, we show that mTORC1 inhibition during glucose deprivation prevented not only the execution of death, but also induction of energetic stress. mTORC1 inhibition during glucose deprivation decreased AMPK activation and allowed ATP to remain high, which was both necessary and sufficient for protection. This effect was not due to increased catabolic activities such as autophagy, but rather exclusively due to decreased anabolic processes, reducing energy consumption. Specifically, TSC1/2-/- cells become highly dependent on glutamate dehydrogenase-dependent glutamine metabolism via the TCA cycle for survival. Therefore, mTORC1 inhibition during energetic stress is primarily to balance metabolic demand with supply.


Figures

Figure 1
Figure 1. mTORC1 suppression protects TSC deficient cells from glucose deprivation-induced death through a p53-independent mechanism
A. TSC1+/+ p53+/+ and TSC1-/- p53+/+ MEFs were deprived of glucose for 48 hours with or without rapamycin, and phase microscopy was used to observe cell viability. B. Cell viability from A was measured via propidium iodide (PI) exclusion assay. C. ELT-3 and LExF were deprived of glucose for 72 hours with or without rapamycin. D. Phase image of TSC2-/- p53-/- or TSC2+/+ p53-/- MEFs deprived of glucose for 60 hours. E. Western blot of p53. F. PI-exclusion assay from D. G. Cell viability following Raptor knockdown. H. Knockdown efficiency for Raptor and phospho-S6K1. Shown is an average (+ SEM) of 3 independent experiments.
Figure 2
Figure 2. mTORC1 inhibition maintains cellular bioenergetics in the absence of glucose
A.The cellular morphology of TSC2-/- p53-/- control and Bcl-XL expressing cells after 48 H of glucose withdrawal. B. The expression level of Bcl-XL and the phosphorylation of S6K1. C. Cell viability of TSC2-/- p53-/- Bcl-XL cells at 96 hours post serum withdrawal. D. The viability of control or Bcl-XL expressing TSC2-/- p53-/- MEFs at 60 hours of glucose deprivation. Shown is an average (+ SEM) of 3 independent experiments. E. Cell size of TSC2-/- p53-/- Bcl-XL MEFs. F. F- versus G- actin population after glucose deprivation in TSC2-/- p53-/- Bcl-XL MEFs. JASP = Jasplakinolide (1μM). LatA = Latrunculin A (2μM). G. Cellular ATP levels in control or Bcl-XL expressing MEFs were determined after 24 hours of glucose deprivation with or without rapamycin. The control cells were plated at the same density and given fresh media at the time of glucose deprivation. H. ATP levels were measured following 24 hours of glucose deprivation in TSC2+/+ and TSC2-/- cells. I. ATP and ADP levels in the same conditions as H; ATP: p < 0.0001; ADP: p = 0.11 J. ATP/ADP ratio was determined from H. K. AMPKα phosphorylation (Thr172) and ACC phosphorylation was measured 24 hours after glucose withdrawal.
Figure 3
Figure 3. L-glutamine is required for rapamycin-mediated ATP maintenance in the absence of glucose
A. TSC2-/- p53-/- MEFs were deprived of glucose, amino acids, or both with or without rapamycin. B. Cell viability of cell with Branched chain amino acids (BCAAs), L-glutamine, or total amino depletion. C. Total cellular ATP levels were determined after 24 hours of glucose deprivation. D. S6K-1 (T389) phosphorylation after 24 hours of deprivation. E. L-glutamine was added to glucose and total amino acid deprived conditions at the time of deprivation, and viability was measured at 60 H post withdrawal. F. A time course measuring the viability of TSC2-/- p53-/- MEFs grown in complete, (-) glucose, (-)Glu (-)AA, and (-)glu (-)AA plus 4mM L-glutamine media. The samples labeled with X were replenished with only glutamine (2mM) starting at 48 hours and replenished every 24 hours. The Rap X sample also got 20nM of rapamycin at 0 and 72 hours. G. Phase images were taken at 3 days and 6 days with or without L-glutamine (2mM) retreatment in (-) glucose (-) amino acids conditions. Shown is an average (+ SEM) of 3 independent experiments.
Figure 4
Figure 4. Mitochondrial activity is not increased in rapamycin treated TSC2-/- p53-/- MEFs
A. TSC2-/- p53-/- MEFs were deprived of glucose for 24 hours, and the rate of oxygen consumption was measured. Oxygen consumption was measured by Clark's electrode, and the rate of consumption was determined and indicated as nmol of oxygen per minute per million cells. The experiment was conducted 3 times and yielded similar results. B. Mitochondrial membrane potential was measure at 12 and 24 hours post treatment conditions via DiOC6 MFI via FACs. Oligomycin was used as a positive control (5μg/mL) in cells grown in glucose containing media. (n = 3) C. PGC-1α and cytochrome c protein levels were determined at 24 hours post-deprivation. D. Mitotracker measurement in the absence of glucose, and with or without rapamycin.
Figure 5
Figure 5. mTORC1 regulates metabolic consumption, and modulating consumption is necessary and sufficient to regulate survival in the absence of glucose
A. TSC2-/- p53-/- MEFs were incubated with rapamycin for 24 hours, cycloheximide (CHX) (5μg/mL) for 12 hours, and amino acid deprived media with glutamine, (-)AA (+)Gln, for 12 hours. Thereafter, the cells were briefly washed in (-)Glu (-)AA media and incubated with glucose free media containing oligomycin (10μg/mL) and antimycin A (2μg/mL). The (-)AA (+)Gln samples were incubated in (-)Glu, (-)AA, (+)Gln media with oligomycin and antimycin. The cells were immediately incubated in 37°C, and ATP levels were measured at indicated time points. All media used for washing and incubating was maintained at 37°C at all times. Experiments were carried out in pentuplicate, and data are presented as a percent of control, which is the ATP level prior to incubation in the glucose free/oligomycin/antimycin media. Student t-test: * p < 0.001 compared to control. B. ATP levels were measured 24 hours after glucose deprivation in TSC2-/- p53-/- MEFs incubated with rapamycin (20nM), ouabain (1mM), and rapamycin/gramicidin D (1μg/mL). GramD = gramicidin D; Student t-test: (-) Glu compared to (-)Glu + Ouabain: p < 0.01 C. Cell viability was measured 60 Hours post glucose deprivation. D. Cell viability for the effect of gramicidin D at the indicated concentrations was measured at 60 hours post glucose deprivation. E. ATP levels were measured similarly to A except CHX (5μg/mL) was used. Gramicidin D (2μg/mL) was given to both samples 5 hours prior to lysis. 2μg/mL was used because we observed that a higher concentration was necessary to have a much more dramatic effect on cycloheximide treated cells. F. Cell viability of the groups was measured at indicated time points with PI-exclusion assay. G. The activation status of S6K1 (T389) was measured from cells deprived of glucose for 24 hours and treated with rapamycin, ouabain (1mM), and CHX (5μg/mL). Shown is an average (+ SEM) of 3 independent experiments for all viability experiments.
Figure 6
Figure 6. TCA cycle intermediates can substitute for glutamine only when energetic consumption is decreased
A. A diagram showing the TCA cycle intermediates, and the compounds used for this study are indicated with *. B. TSC2-/- p53-/- MEFs were deprived of glucose and were given extra 4mM or 8 mM of glutamine to give a final concentration of 4mM, 8mM, and 12mM. Cell viability was measure at 60 hours post deprivation. C. TSC2-/- p53-/- MEFs were deprived of amino acids and glucose, and given the indicated molecules. Cell viability was measured at 48 hours post deprivation. Shown is an average (+ SEM) of 3 independent experiments.
Figure 7
Figure 7. Pharmacologic inhibition of the glutamine metabolism pathway induces cytotoxicity under glucose limiting conditions
A. A diagram showing the enzymes involved in glutamate metabolism (See text for more details). B. EGCG (50μM) and AOA (0.25 to 5.0 mM) were tested for cytotoxicity of TSC2-/- cells deprived of glucose and given rapamycin (48 Hours post deprivation). Where indicated, various metabolites α-ketoglutarate (10mM), glutamate (4mM), and pyruvate (1mM) were also supplemented. C. TSC2-/- cells were infected with shRNA constructs (#1-4) targeting GDH, and viability after 60 hours without glucose with or without rapamycin is shown. D. TSC2-/- cells deprived of glucose and amino acids, but supplemented with glutamine (4mM) were given EGCG (50μM) or AOA (2mM).

Comment in

  • A metabolic (re-)balancing act.
    Abraham RT, Eng CH. Abraham RT, et al. Mol Cell. 2010 May 28;38(4):481-2. doi: 10.1016/j.molcel.2010.05.008. Mol Cell. 2010. PMID: 20513422

Similar articles

Cited by

References

    1. Balaban RS, Mandel LJ, Soltoff SP, Storey JM. Coupling of active ion transport and aerobic respiratory in isolated renal tubules. Proc. Natl. Acad. Sci. USA. 1980;77:447–51. - PMC - PubMed
    1. Bissler JJ, McCormack FX, Young LR, Elwing JM, Chuck G, Leonard JM, Schmithorst VJ, Laor T, Brody AS, Bean J, et al. Sirolimus for angiomyolipoma in tuberous sclerosis complex or lymphangioleiomyomatosis. N. Engl. J. Med. 2008;358:140–51. - PMC - PubMed
    1. Buller CL, Loberg RD, Fan MH, Zhu Q, Park JL, Vesely E, Inoki K, Guan KL, Brosius FC., 3rd A GSK-3/TSC2/mTOR pathway regulates glucose uptake and GLUT1 glucose transporter expression. Am. J. Physiol. Cell. Physiol. 2008;295:836–43. - PMC - PubMed
    1. Buttgereit F, Brand MD. A hierarchy of ATP-consuming processes in mammalian cells. Biochem. J. 1995;312:163–7. - PMC - PubMed
    1. Buzzai M, Bauer DE, Jones RG, Deberardins RJ, Hatzivassiliou G, Elstrom RL, Thompson CB. The glucose dependence of Akt-transformed cells can be reversed by pharmacologic activation of fatty acid beta-oxidation. Oncogene. 2005;24:4165–73. - PubMed

Publication types

MeSH terms