Comparative Study
. 2010 May 29:11:343.
doi: 10.1186/1471-2164-11-343.

Regulation of the cardiomyocyte transcriptome vs translatome by endothelin-1 and insulin: translational regulation of 5' terminal oligopyrimidine tract (TOP) mRNAs by insulin

Affiliations
Comparative Study

Regulation of the cardiomyocyte transcriptome vs translatome by endothelin-1 and insulin: translational regulation of 5' terminal oligopyrimidine tract (TOP) mRNAs by insulin

Thomais Markou et al. BMC Genomics. .

Abstract

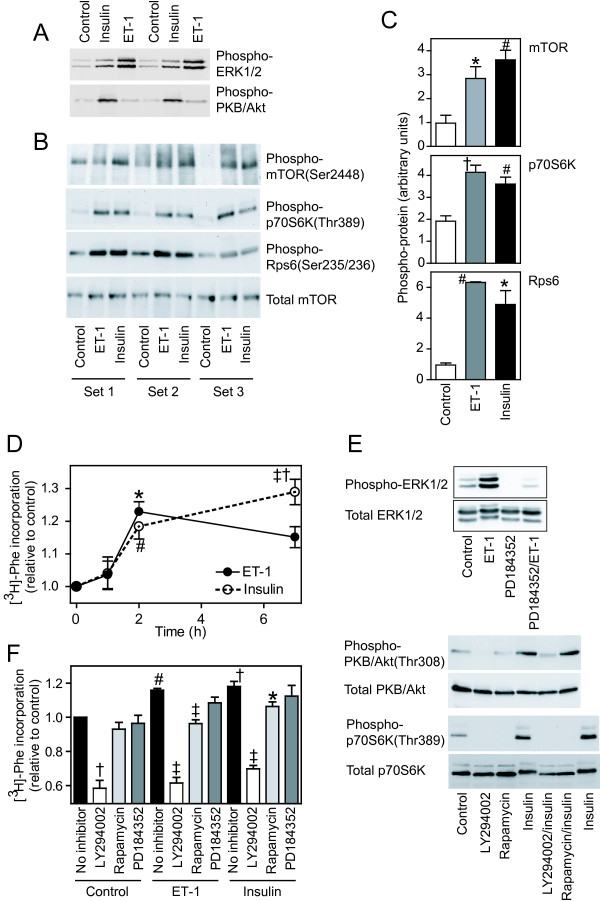
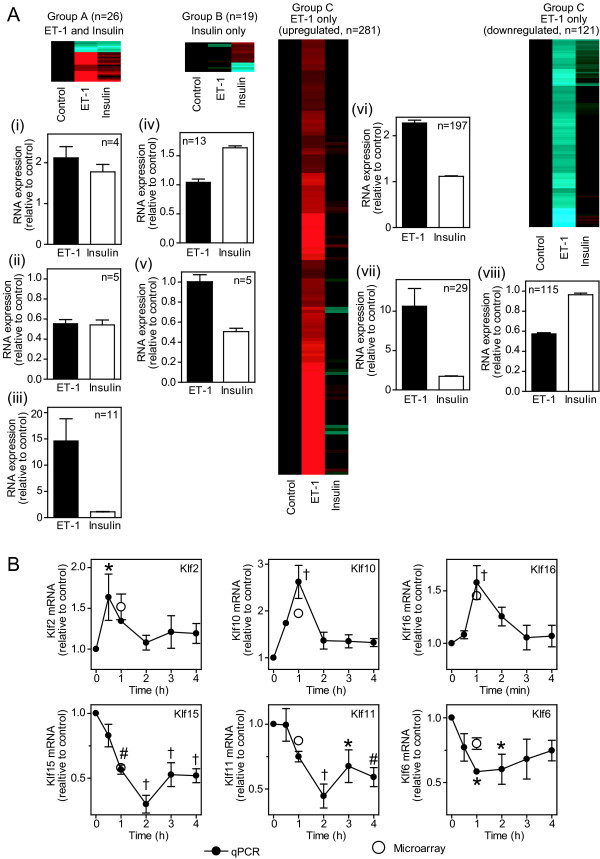
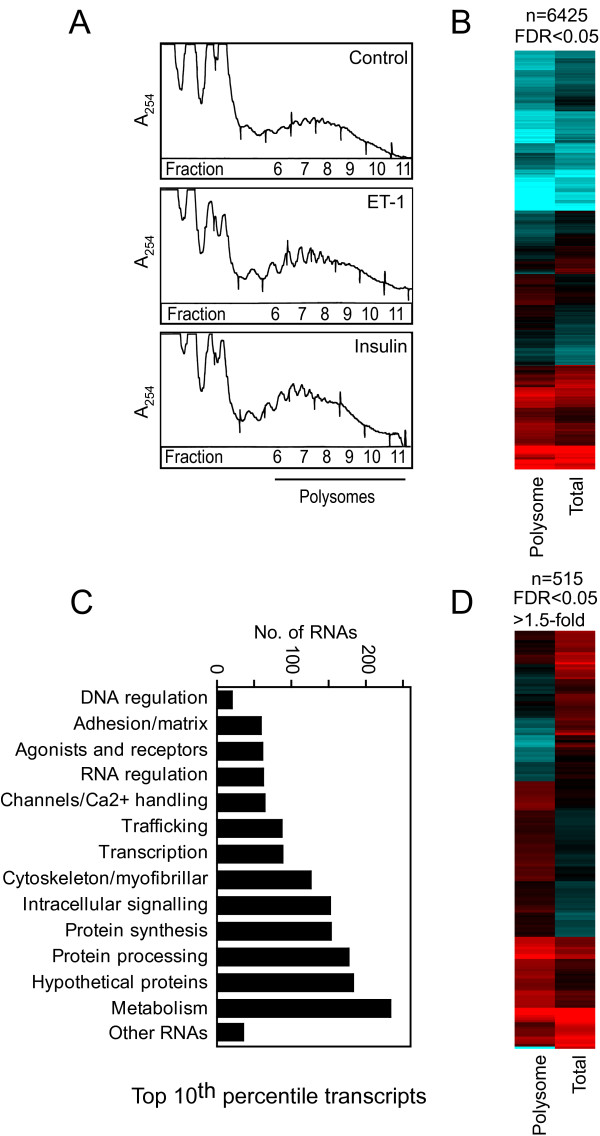
Background: Changes in cellular phenotype result from underlying changes in mRNA transcription and translation. Endothelin-1 stimulates cardiomyocyte hypertrophy with associated changes in mRNA/protein expression and an increase in the rate of protein synthesis. Insulin also increases the rate of translation but does not promote overt cardiomyocyte hypertrophy. One mechanism of translational regulation is through 5' terminal oligopyrimidine tracts (TOPs) that, in response to growth stimuli, promote mRNA recruitment to polysomes for increased translation. TOP mRNAs include those encoding ribosomal proteins, but the full panoply remains to be established. Here, we used microarrays to compare the effects of endothelin-1 and insulin on the global transcriptome of neonatal rat cardiomyocytes, and on mRNA recruitment to polysomes (i.e. the translatome).

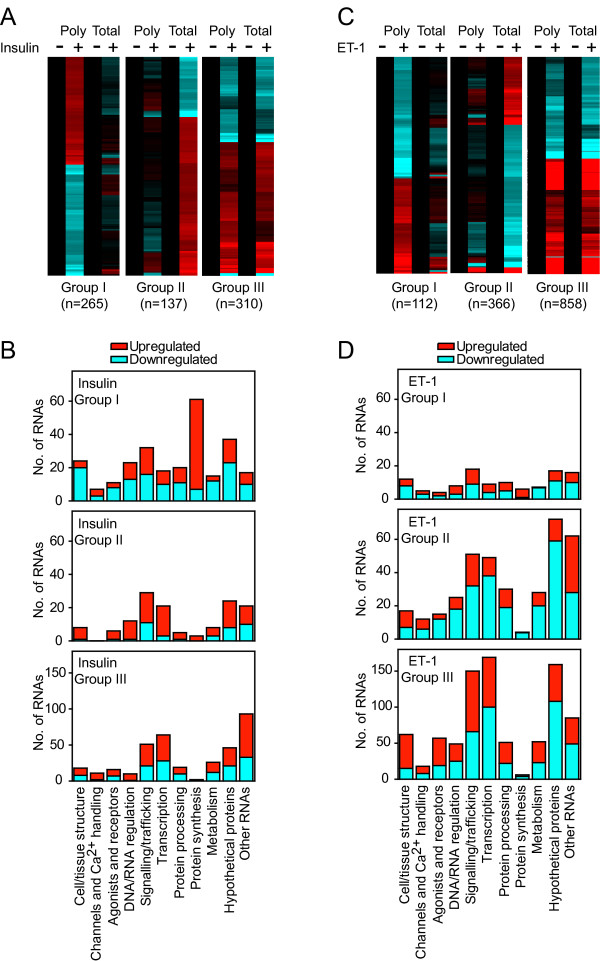
Results: Globally, endothelin-1 and insulin (1 h) promoted >1.5-fold significant (false discovery rate < 0.05) changes in expression of 341 and 38 RNAs, respectively. For these transcripts with this level of change there was little evidence of translational regulation. However, 1336 and 712 RNAs had >1.25-fold significant changes in expression in total and/or polysomal RNA induced by endothelin-1 or insulin, respectively, of which approximately 35% of endothelin-1-responsive and approximately 56% of insulin-responsive transcripts were translationally regulated. Of mRNAs for established proteins recruited to polysomes in response to insulin, 49 were known TOP mRNAs with a further 15 probable/possible TOP mRNAs, but 49 had no identifiable TOP sequences or other consistent features in the 5' untranslated region.

Conclusions: Endothelin-1, rather than insulin, substantially affects global transcript expression to promote cardiomyocyte hypertrophy. Effects on RNA recruitment to polysomes are subtle, with differential effects of endothelin-1 and insulin on specific transcripts. Furthermore, although insulin promotes recruitment of TOP mRNAs to cardiomyocyte polysomes, not all recruited mRNAs are TOP mRNAs.


Figures

Figure 1
Figure 1
Protein kinase signaling and regulation of protein synthesis by ET-1 and insulin. Cardiomyocytes were exposed to 100 nM ET-1 or 50 mU/ml insulin or left unstimulated. A-C, Cardiomyocytes were exposed to agonists for 5 min (A) or 15 min (B and C). Protein extracts were immunoblotted with antibodies to phosphorylated ERK1/2 (A, upper panel), phosphorylated PKB/Akt (A, lower panel), phosphorylated mTOR (B, top panel), phosphorylated p70S6k (B, upper center panel), phosphorylated Rps6 (B, lower center panel) or total mTOR (B, lower panel). Each set of samples was prepared from a separate preparation of cardiomyocytes. C, Bands from images in panel B were quantified by scanning densitometry. Results are means ± SEM (n = 3). * p < 0.05, # p < 0.01, † p < 0.001 relative to controls (one-way ANOVA with Tukey post-test). D, Cardiomyocytes were exposed to agonists for the total time indicated and rate of protein synthesis was measured over the last 1 h of incubation using [3H]-Phe. Results are means ± SEM (n = 5 independent preparations of cardiomyocytes). * p < 0.05, # p < 0.01, † p < 0.001 relative to controls, ‡ p < 0.05 relative to 2 h (one-way ANOVA with Tukey post-test). E, Cardiomyocytes were unstimulated (Control) or exposed to agonists/inhibitors as follows: ET-1 (5 min), PD184352 (2 μM, 15 min), PD184352/ET-1 (10 min pretreatment with PD184352 before addition of ET-1 for 5 min), insulin (10 min), LY294002 (50 μM, 20 min), rapamycin (1 μM, 20 min), LY294002/insulin or rapamycin/insulin (10 min pretreatment with inhibitor before addition of insulin for 10 min). Extracts were immunoblotted for phosphorylated and total ERK1/2, PKB/Akt and p70S6K as indicated. Experiments were repeated with similar results. F, Cardiomyocytes were exposed for 2 h to 50 μM LY294005, 1 μM rapamycin, 2 μM PD184352, 100 nM ET-1 or 50 mU/ml insulin, or ET-1 or insulin in the presence of each inhibitor. The rate of protein synthesis was measured over the last 1 h of incubation using [3H]-Phe. Results are means ± SEM (n = 5 independent preparations of cardiomyocytes). # p < 0.01, † p < 0.001 relative to controls, * p < 0.05, ‡ p < 0.001 relative to ET-1 or insulin alone (one-way ANOVA with Tukey post-test).
Figure 2
Figure 2
Effects of ET-1 and insulin on the global cardiomyocyte transcriptome. A, Cardiomyocytes were exposed to 100 nM ET-1 or 50 mU/ml insulin (1 h) or left unstimulated (Control). Total RNA was extracted and the global transcriptome analysed using microarrays. Transcripts with significant changes in expression (FDR < 0.05, >1.5-fold change) induced by either ET-1 or insulin relative to controls were clustered according to responsiveness to both agonists [Group A: (i) similar upregulation with both, (ii) similar downregulation with both, (iii) greater response to ET-1 than insulin], responsiveness to insulin alone [Group B: (iv) upregulated by insulin, (v) downregulated by insulin] or responsiveness to ET-1 alone [Group C: (vi) and (vii) upregulated by ET-1, (viii) downregulated by ET-1. Heatmaps represent the mean values of all probesets in each group with normalisation per gene to control values [Log2 scale; -2.0 (cyan) through 0 (black) to 2.0 (red)]. Histograms are means ± SEM for the RNAs in each group (numbers of transcripts in parentheses). B, Cardiomyocytes were exposed to insulin for the times indicated and mRNA expression of Klf2, Klf6, Klf10, Klf11, Klf15 and Klf16 measured by qPCR. Data were normalised to Gapdh. Solid circles represent qPCR data. Results are means ± SEM (n = 3 independent preparations of cardiomyocytes). * p < 0.05, # p < 0.01, † p < 0.001 relative to controls (one-way ANOVA with Tukey post-test). For comparison, microarray data are shown as open circles (means ± SEM, n = 4).
Figure 3
Figure 3
Differential recruitment of cardiomyocyte RNAs to polysomes.Cardiomyocytes were serum-starved (20 h). Polysomes prepared by sucrose density centrifugation. Total and polysomal RNA were extracted and analysed using microarrays. A, A254 profiles for sucrose density centrifugation. B, Heatmap of the mean raw fluorescence values for the 6425 probesets with significantly different expression in polysomal and total RNA pools in unstimulated cells [Log2 scale; 7 (cyan) through 10 (black) to 13 (red)]. C, Functional classification of top 10th percentile transcripts detected in cardiomyocytes. D, Heatmap for the 515 probesets of the top 10th percentile with significantly different expression (FDR < 0.05, >1.5-fold difference) in polysomal and total RNA pools in unstimulated cells [Log2 scale; 9.5 (cyan) through 11.5 (black) to 13.5 (red)].
Figure 4
Figure 4
Translational regulation of cardiomyocyte transcripts by insulin or ET-1.Cardiomyocytes were exposed to 100 nM ET-1 or 50 mU/ml insulin (1 h) or were left unstimulated. Polysomes were prepared by sucrose density centrifugation. Total and polysomal RNA were extracted and analysed using microarrays. RNAs with significant changes in expression (FDR < 0.05, >1.25-fold change) induced by insulin (A and B) or ET-1 (C and D) in either total or polysomal RNA pools were identified and clustered according to regulation in polysomal RNA only (Group I; FDR < 0.05 in polysomal RNA only and expression ratio >1.2 for polysomal RNA:total RNA), regulation in total RNA only (Group II; FDR < 0.05 in total RNA only and expression ratio >1.2 for total RNA:polysomal RNA) or similar regulation in both (Group III; FDR < 0.05 in both polysomal and total RNA, or expression ratio <1.2). A, Heatmap for insulin-regulated probesets showing the mean values of all probesets in each group with normalisation per gene to control values [Log2 scale; -0.7 (cyan) through 0 (black) to 0.7 (red)]. C, Heatmap for ET-1-regulated probesets showing the mean values of all probesets in each group with normalisation per gene to control values [Log2 scale; -1.5 (cyan) through 0 (black) to 1.5 (red)]. B and D, Functional classification of the RNAs illustrated in panels A and C, respectively, showing the numbers of RNAs in each group (numbers of upregulated and downregulated RNAs are represented in red and cyan, respectively).
Figure 5
Figure 5
Insulin increases ribosomal content in cardiomyocytes. Cardiomyocytes (4 × 10⁶ cells per sample) were exposed to 50 mU/ml insulin or were left unstimulated. A, RNA was extracted from cardiomyocytes exposed to insulin for 1 h. Rps3 and Rps6 mRNA expression was measured by qPCR using the absolute quantification protocol. Results are expressed relative to unstimulated controls and are means ± SEM (n = 8 independent preparations of cardiomyocytes). * p < 0.05 relative to controls (Student's t-test). B, Protein extracts from cardiomyocytes exposed to insulin for 0, 2 or 4 h were immunoblotted with antibodies to Rps3 (upper panel) or Rps6 (center panel). * p < 0.05 relative to controls (Student's t-test). C and D, RNA was extracted and analysed for 18S and 28S ribosomal RNA content using an Agilent Bioanalyser. Representative traces are shown in panel C for unstimulated (Control) cells and cells exposed to insulin for 1 h. The areas under the 18S and 28S peaks were integrated and the results are shown in panel D as means ± SEM (n = 3 independent preparations of cardiomyocytes). * p < 0.05, # p < 0.01 relative to controls (one-way ANOVA with Tukey post-test).

Similar articles

Cited by

References

    1. Proud CG. Signalling to translation: how signal transduction pathways control the protein synthetic machinery. Biochem J. 2007;403:217–234. doi: 10.1042/BJ20070024. - DOI - PubMed
    1. Sonenberg N, Hinnebusch AG. Regulation of translation initiation in eukaryotes: mechanisms and biological targets. Cell. 2009;136:731–745. doi: 10.1016/j.cell.2009.01.042. - DOI - PMC - PubMed
    1. Pickering BM, Willis AE. The implications of structured 5' untranslated regions on translation and disease. Semin Cell Dev Biol. 2005;16:39–47. doi: 10.1016/j.semcdb.2004.11.006. - DOI - PubMed
    1. Meyuhas O. Synthesis of the translational apparatus is regulated at the translational level. Eur J Biochem. 2000;267:6321–6330. doi: 10.1046/j.1432-1327.2000.01719.x. - DOI - PubMed
    1. Iadevaia V, Caldarola S, Tino E, Amaldi F, Loreni F. All translation elongation factors and the e, f, and h subunits of translation initiation factor 3 are encoded by 5'-terminal oligopyrimidine (TOP) mRNAs. RNA. 2008;14:1730–1736. doi: 10.1261/rna.1037108. - DOI - PMC - PubMed

Publication types

MeSH terms