

Matrix metalloproteinase 13 loss associated with impaired extracellular matrix remodeling disrupts chondrocyte differentiation by concerted effects on multiple regulatory factors
- PMID: 20506238
- PMCID: PMC2921033
- DOI: 10.1002/art.27512
Matrix metalloproteinase 13 loss associated with impaired extracellular matrix remodeling disrupts chondrocyte differentiation by concerted effects on multiple regulatory factors
Abstract
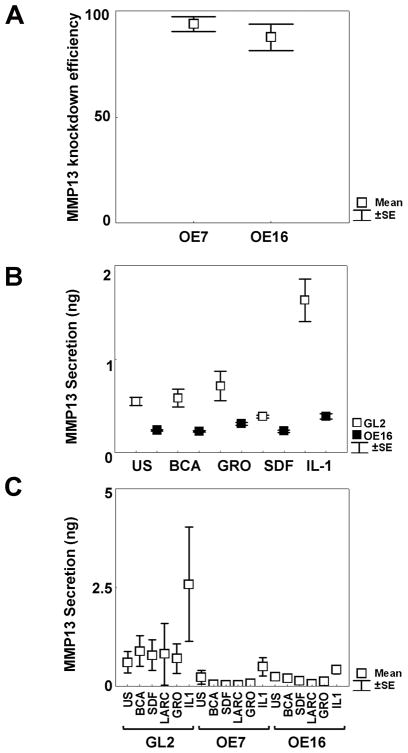
Objective: To link matrix metalloproteinase 13 (MMP-13) activity and extracellular matrix (ECM) remodeling to alterations in regulatory factors leading to a disruption in chondrocyte homeostasis.
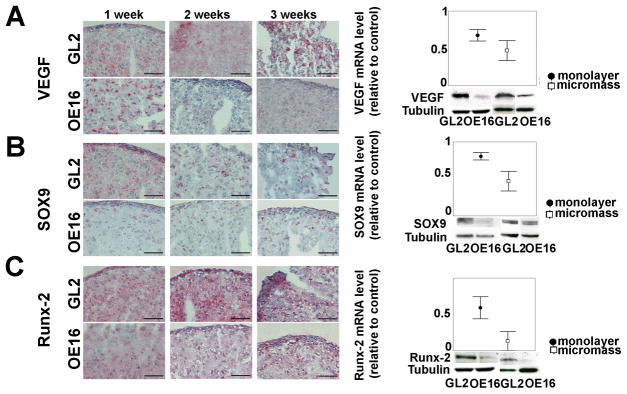
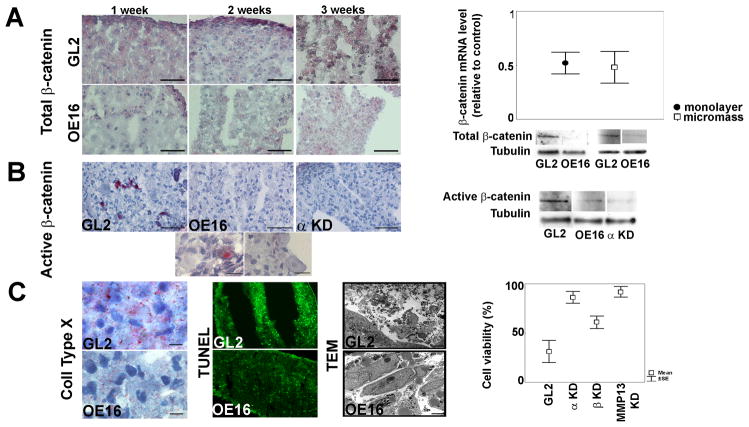
Methods: MMP-13 expression was ablated in primary human chondrocytes by stable retrotransduction of short hairpin RNA. The effects of MMP-13 knockdown on key regulators of chondrocyte differentiation (SOX9, runt-related transcription factor 2 [RUNX-2], and beta-catenin) and angiogenesis (vascular endothelial growth factor [VEGF]) were scored at the protein level (by immunohistochemical or Western blot analysis) and RNA level (by real-time polymerase chain reaction) in high-density monolayer and micromass cultures under mineralizing conditions. Effects on cellular viability in conjunction with chondrocyte progression toward a hypertrophic-like state were assessed in micromass cultures. Alterations in SOX9 subcellular distribution were assessed using confocal microscopy in micromass cultures and also in osteoarthritic cartilage.
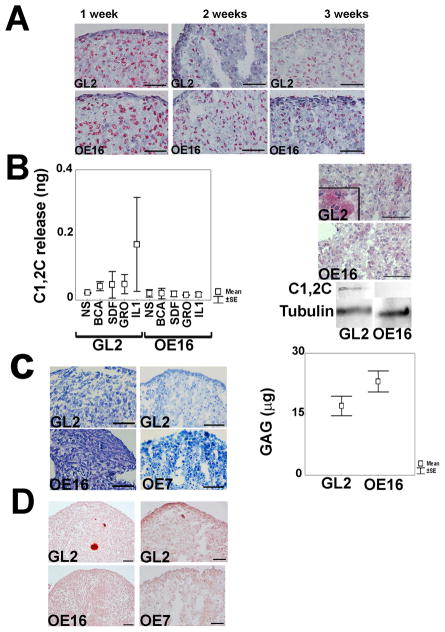
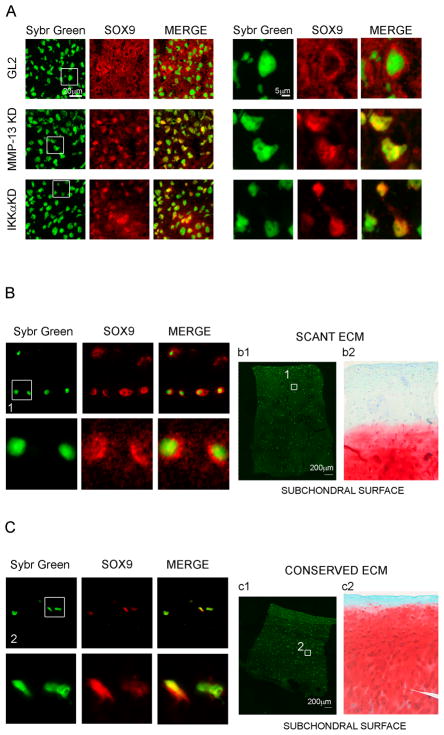
Results: Differentiation of control chondrocyte micromasses progressed up to a terminal phase, with calcium deposition in conjunction with reduced cell viability and scant ECM. MMP-13 knockdown impaired ECM remodeling and suppressed differentiation in conjunction with reduced levels of RUNX-2, beta-catenin, and VEGF. MMP-13 levels in vitro and ECM remodeling in vitro and in vivo were linked to changes in SOX9 subcellular localization. SOX9 was largely excluded from the nuclei of chondrocytes with MMP-13-remodeled or -degraded ECM, and exhibited an intranuclear staining pattern in chondrocytes with impaired MMP-13 activity in vitro or with more intact ECM in vivo.
Conclusion: MMP-13 loss leads to a breakdown in primary human articular chondrocyte differentiation by altering the expression of multiple regulatory factors.
Figures
Similar articles
-
IKKα/CHUK regulates extracellular matrix remodeling independent of its kinase activity to facilitate articular chondrocyte differentiation.PLoS One. 2013 Sep 2;8(9):e73024. doi: 10.1371/journal.pone.0073024. eCollection 2013. PLoS One. 2013. PMID: 24023802 Free PMC article.
-
Differential requirements for IKKalpha and IKKbeta in the differentiation of primary human osteoarthritic chondrocytes.Arthritis Rheum. 2008 Jan;58(1):227-39. doi: 10.1002/art.23211. Arthritis Rheum. 2008. PMID: 18163512 Free PMC article.
-
Positive Effects of a Young Systemic Environment and High Growth Differentiation Factor 11 Levels on Chondrocyte Proliferation and Cartilage Matrix Synthesis in Old Mice.Arthritis Rheumatol. 2020 Jul;72(7):1123-1133. doi: 10.1002/art.41230. Epub 2020 May 21. Arthritis Rheumatol. 2020. PMID: 32067417
-
The ECM-cell interaction of cartilage extracellular matrix on chondrocytes.Biomed Res Int. 2014;2014:648459. doi: 10.1155/2014/648459. Epub 2014 May 18. Biomed Res Int. 2014. PMID: 24959581 Free PMC article. Review.
-
Chondrocyte Homeostasis and Differentiation: Transcriptional Control and Signaling in Healthy and Osteoarthritic Conditions.Life (Basel). 2023 Jun 28;13(7):1460. doi: 10.3390/life13071460. Life (Basel). 2023. PMID: 37511835 Free PMC article. Review.
Cited by
-
Blocking TNFα attenuates progressive cartilage matrix degradation in inflammatory arthritis.Exp Ther Med. 2021 Aug;22(2):808. doi: 10.3892/etm.2021.10240. Epub 2021 May 27. Exp Ther Med. 2021. PMID: 34093764 Free PMC article.
-
Mechanical forces induce changes in VEGF and VEGFR-1/sFlt-1 expression in human chondrocytes.Int J Mol Sci. 2014 Sep 1;15(9):15456-74. doi: 10.3390/ijms150915456. Int J Mol Sci. 2014. PMID: 25257525 Free PMC article.
-
IKKα/CHUK regulates extracellular matrix remodeling independent of its kinase activity to facilitate articular chondrocyte differentiation.PLoS One. 2013 Sep 2;8(9):e73024. doi: 10.1371/journal.pone.0073024. eCollection 2013. PLoS One. 2013. PMID: 24023802 Free PMC article.
-
Developmental mechanisms in articular cartilage degradation in osteoarthritis.Arthritis. 2011;2011:683970. doi: 10.1155/2011/683970. Epub 2010 Dec 29. Arthritis. 2011. PMID: 22046522 Free PMC article.
-
Lithium Chloride Dependent Glycogen Synthase Kinase 3 Inactivation Links Oxidative DNA Damage, Hypertrophy and Senescence in Human Articular Chondrocytes and Reproduces Chondrocyte Phenotype of Obese Osteoarthritis Patients.PLoS One. 2015 Nov 30;10(11):e0143865. doi: 10.1371/journal.pone.0143865. eCollection 2015. PLoS One. 2015. PMID: 26618897 Free PMC article.
References
-
- Drissi H, Zuscik M, Rosier R, O’Keefe R. Transcriptional regulation of chondrocyte maturation: potential involvement of transcription factors in OA pathogenesis. Mol Aspects Med. 2005;26(3):169–79. - PubMed
-
- Olivotto E, Vitellozzi R, Fernandez P, Falcieri E, Battistelli M, Burattini S, et al. Chondrocyte hypertrophy and apoptosis induced by GROalpha require three-dimensional interaction with the extracellular matrix and a co-receptor role of chondroitin sulfate and are associated with the mitochondrial splicing variant of cathepsin B. J Cell Physiol. 2007;210(2):417–27. - PubMed
Publication types
MeSH terms
Substances
Grants and funding
LinkOut - more resources
Full Text Sources
Other Literature Sources
Research Materials
