Comparative Study
. 2010 Aug;299(2):C289-97.
doi: 10.1152/ajpcell.00362.2009. Epub 2010 May 26.

Effect of hypernatremia on injury caused by energy deficiency: role of T-type Ca2+ channel

Affiliations
Comparative Study

Effect of hypernatremia on injury caused by energy deficiency: role of T-type Ca2+ channel

Viktor Pastukh et al. Am J Physiol Cell Physiol. 2010 Aug.

Abstract

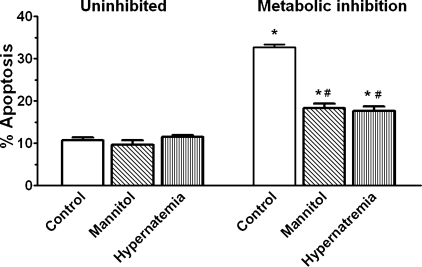
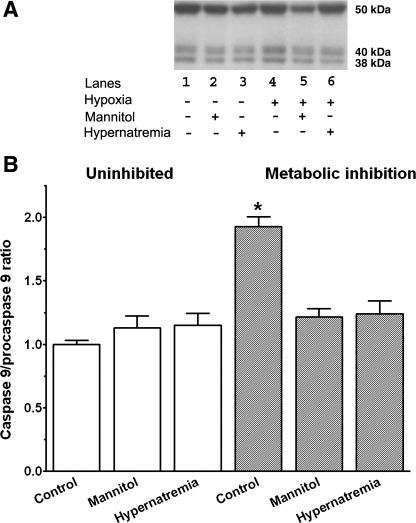
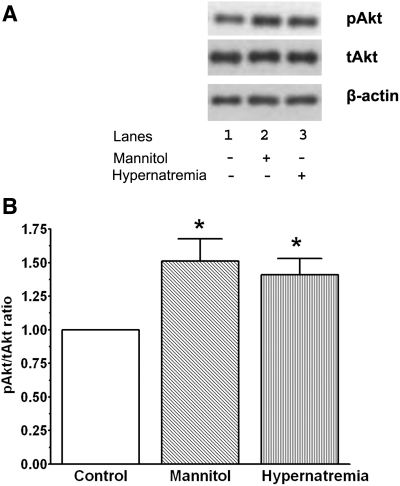
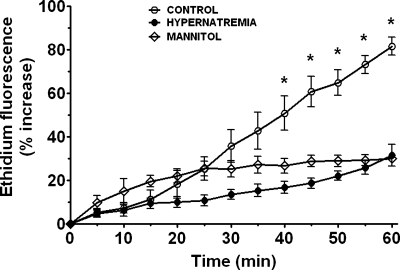
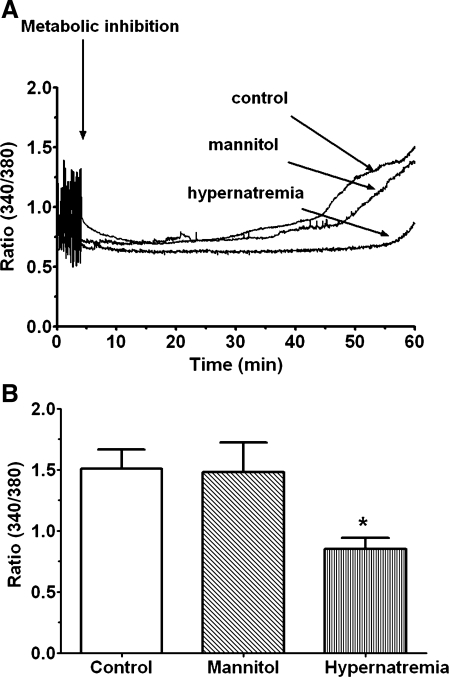
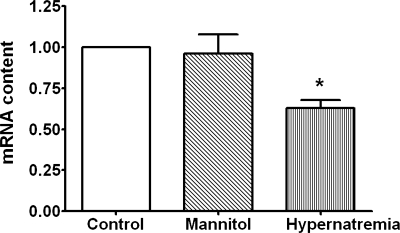
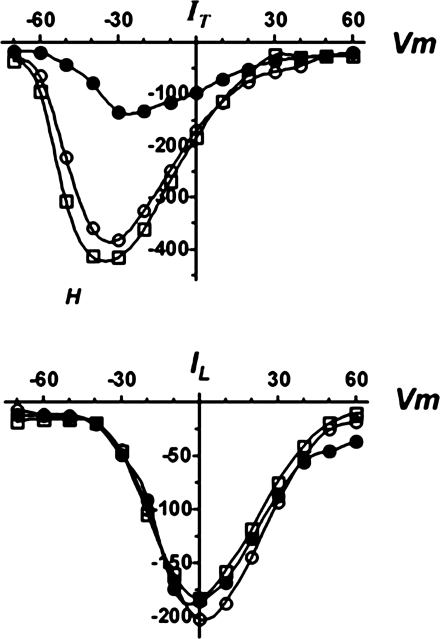
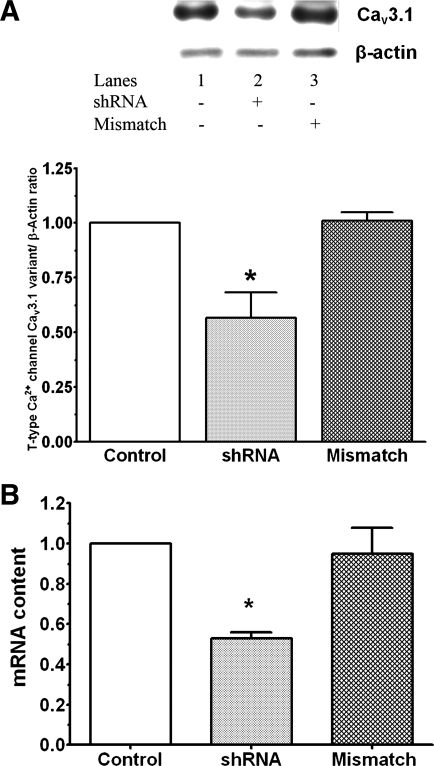
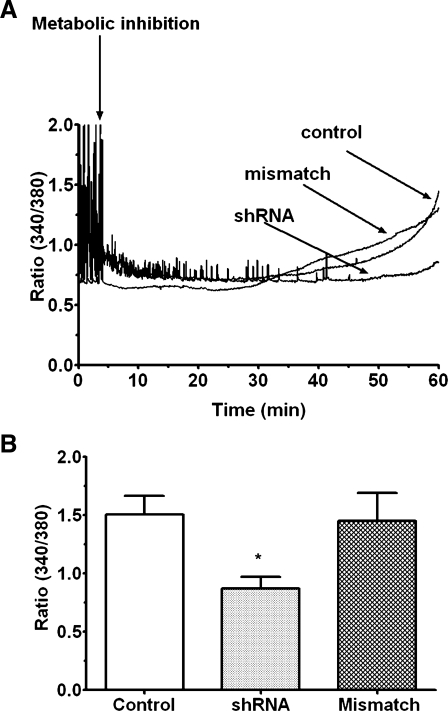
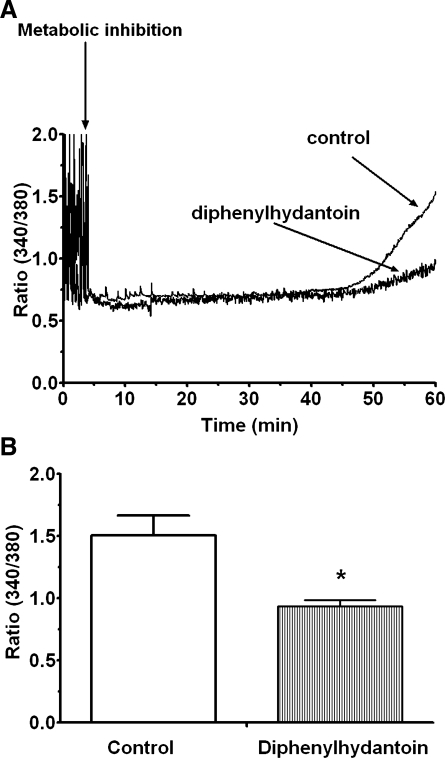
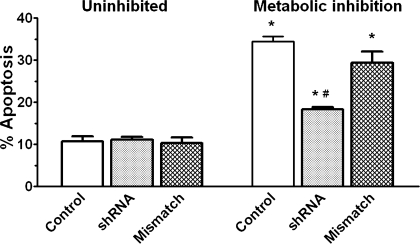
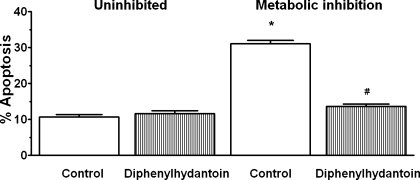
Hypernatremia exerts multiple cellular effects, many of which could influence the outcome of an ischemic event. To further evaluate these effects of hypernatremia, isolated neonatal cardiomyocytes were chronically incubated with medium containing either normal (142 mM) or elevated sodium (167 mM) and then transferred to medium containing deoxyglucose and the electron transport chain inhibitor amobarbital. Chronic hypernatremia diminished the degree of calcium accumulation and reactive oxygen species generation during the period of metabolic inhibition. The improvement in calcium homeostasis was traced in part to the downregulation of the Ca(V)3.1 T-type calcium channel, as deficiency in the Ca(V)3.1 subtype using short hairpin RNA or treatment with an inhibitor of the Ca(V)3.1 variant of the T-type calcium channel (i.e., diphenylhydantoin) attenuated energy deficiency-mediated calcium accumulation and cell death. Although hyperosmotically stressed cells (exposed to 50 mM mannitol) had no effect on T-type calcium channel activity, they were also resistant to death during metabolic inhibition. Both hyperosmotic stress and hypernatremia activated Akt, suggesting that they initiate the phosphatidylinositol 3-kinase/Akt cytoprotective pathway, which protects the cell against calcium overload and oxidative stress. Thus hypernatremia appears to protect the cell against metabolic inhibition by promoting the downregulation of the T-type calcium channel and stimulating cytoprotective protein kinase pathways.


Figures

Fig. 1.
Fig. 1.
Effect of hyperosmotic stress and hypernatremia on apoptosis mediated by metabolic inhibition. Cardiomyocytes were incubated for 3 days with medium containing either no additions (control, contains 142 mM Na+), 167 mM total Na+ (hypernatremia), or 50 mM mannitol (mannitol), the latter to mimic the osmotic stress component of hypernatremia, which involves an increase of 25 mM Na+ and 25 mM Cl. Some of the cells were subjected to 1 h of metabolic inhibition (in medium containing 142 mM Na+ and the metabolic inhibitors) and examined for apoptosis [terminal deoxynucleotidyl transferase dUTP-mediated nick-end (TUNEL) staining]. Values are means ± SE of 5 different preparations. *P < 0.05, significant difference from the uninhibited control. #P < 0.05, significant difference from the metabolically inhibited control.
Fig. 2.
Fig. 2.
Effect of hypernatremia and hyperosmotic stress on activation of caspase-9 by metabolic inhibition. Control, hypernatremic, and hyperosmotically stressed cardiomyocytes were incubated for 3 days as described in Fig. 1. They were then subjected to 1 h of metabolic inhibition. Cells obtained before and following metabolic inhibition for 1 h were harvested, and Western blot analyses for procaspase-9 (50 kDa) and for the active form of caspase-9 (38 kDa) were then performed. A: representative Western blots of procaspase-9 and active caspase-9. B: relative ratio of active caspase-9 to procaspase-9. The ratio of the uninhibited control was set at 1.0. Values are means ± SE of 3–4 separate preparations. *P < 0.05, significant difference between uninhibited control and metabolically inhibited control cells.
Fig. 3.
Fig. 3.
Effect of hypernatremia and hyperosmotic stress on the phosphorylation status of Akt. Control, hypernatremic, and hyperosmotically stressed cardiomyocytes were incubated for 3 days as described in Fig. 1. Cells were then harvested and Western blot analyses of Akt and phospho-Akt were performed. A: representative Western blots of phospho-Akt (pAkt), total Akt (tAkt), and β-actin. B: relative pAkt-to-tAkt ratio. The ratio of the control was set at 1.0 after being normalized relative to β-actin levels. Values are means ± SE of 4 separate preparations. *P < 0.05, significant difference between hypernatremic and hyperosmotic cells and the control cells.
Fig. 4.
Fig. 4.
Effect of hypernatremia and hyperosmotic stress on superoxide generation. Control and hypernatremic cardiomyocytes were incubated for 3 days as described in Fig. 1. They were then loaded for 1 h with the superoxide sensitive dye dihydroethidium (5 μM). Baseline values of ethidium fluorescence, a measure of cellular superoxide, were monitored by confocal microscopy. Cells were then subjected to metabolic inhibition in medium containing amobarbital and glucose. Changes in ethidium fluorescence were assessed at 5-min intervals. Values are means ± SE of 4–7 different preparations, with at least 10 cells monitored per culture dish. *P < 0.05, significant difference between control and both stressed groups.
Fig. 5.
Fig. 5.
Effect of hypernatremia and hyperosmotic stress on Ca2+ accumulation by the metabolically inhibited cell. Control, hypernatremi,c and hyperosmotically stressed cardiomyocytes were incubated for 3 days as described in Fig. 1. Cells were then loaded with the calcium probe fura-2. Fluorescence at 340 and 380 nm was measured before metabolic inhibition, and data were expressed as the fluorescence ratio (F340/F380), a measure of Ca2+ content. Cells were then subjected to metabolic inhibition, and F340/F380 was continuously monitored. A: representative tracing of F340/F380 for control and hypernatremic cells. B: cumulated data of F340/F380 after 60 min of metabolic inhibition. Data are means ± SE of 5 separate preparations. *P < 0.05, significant difference between the hypernatremic group and the control cells.
Fig. 6.
Fig. 6.
Effect of hypernatremia and osmotic stress on the expression of the T-type Ca2+ channel. Control, hypernatremic, and hyperosmotically stressed cardiomyocytes were incubated for 3 days as described in Fig. 1. Cells were harvested, and total RNA was isolated with TRIzol. Quantitative real-time PCR of the Cav3.1 T-type Ca2+ channel variant was performed using the iScript One-Step real-time-PCR kit with SYBR green. Values are means ± SE of 5 preparations. Control value was set to 1.0. *P < 0.05, significant difference between the mRNA content of the hypernatremic cells and that of the other 2 groups.
Fig. 7.
Fig. 7.
Effect of hypernatremia and hyperosmotic stress on T-type Ca2+ current. Control, hypernatremic and hyperosmotically stressed cardiomyocytes were incubated for 3 days as described in Fig. 1. Properties of the L-type (IL) and T-type (IT) Ca2+ channels were then evaluated. I-V curves (of peak currents) represent the measurements made at holding potentials of −40 mV (bottom) and the difference between the measurements made at −90 and −40 mV (top) from control (○), hypernatremic (●), or mannitol-treated (□) cardiomyocytes. Vm, membrane potential.
Fig. 8.
Fig. 8.
Effect of short hairpin (sh)RNA on the expression of the Cav3.1 T-type Ca2+ channel. Isolated cardiomyocytes were incubated with medium containing or lacking shRNA for Cav3.1; some cells were incubated with a scrambled shRNA. A: cells were harvested and Western blot analyses of the Cav3.1 variant and β-actin were performed. Top: representative Western blots for Cav3.1 and β-actin. Bottom: protein content of the Cav3.1 variant normalized to β-actin content. The normalized value for the Cav3.1 variant in the control cells was set at 1.0. B: cells were harvested and total RNA was isolated. Real-time PCR was performed as described in Fig. 6. Values are means ± SE of 4–6 preparations. *P < 0.05, significant difference between the shRNA-treated group and both the untreated control and the mismatched control.
Fig. 9.
Fig. 9.
Effect of shRNA on Ca2+ accumulation by the metabolically inhibited cell. Cardiomyocytes were treated with either shRNA directed against the Cav3.1 variant of the T-type Ca2+ channel or with mismatched shRNA. After cells were loaded with fura-2, F340/F380, which is a measure of intracellular calcium concentration, was measured in uninhibited cells. Cells were then subjected to metabolic inhibition, and F340/F380 was monitored for 60 min. A: representative tracing for shRNA-treated cells, mismatched shRNA-treated cells, and control cells. B: cumulative values for F340/F380. Values are means ± SE of 3–4 preparations. *P < 0.05, significant difference between the shRNA treated group and the other two control groups.
Fig. 10.
Fig. 10.
Effect of diphenylhydantoin on Ca2+ accumulation by the metabolically inhibited cell. Cardiomyocytes were incubated for 3 days with control medium as described in Fig. 1. After cells were loaded with fura-2, F340/F380 was determined in the uninhibited cells. Cells were then exposed to 1 h of metabolic inhibition in medium containing or lacking an inhibitor of the Cav3.1 variant of the T-type Ca2+ channel (diphenylhydantoin, 100 μM). The F340/F380 of the cells was monitored throughout the period of metabolic inhibition. A: representative tracing for control and diphenylhydantoin-treated cells. B: cumulative values for F340/F380. Values are means ± SE of 4 different preparations. *P < 0.05, significant difference between the diphenylhydantoin treated and untreated cells.
Fig. 11.
Fig. 11.
Effect of shRNA on apoptosis mediated by metabolic inhibition. Cardiomyocytes were treated with shRNA or scrambled shRNA. After an overnight incubation with normal medium, cells were incubated with medium containing amobarbital and deoxyglucose for 1 h and then examined for the presence of apoptotic cells (TUNEL staining). Values are means ± SE of 5 different preparations. *P < 0.05, significant difference between the uninhibited control and the metabolically inhibited control. #P < 0.05, significant difference between the metabolically inhibited shRNA group and the other 2 metabolically inhibited groups.
Fig. 12.
Fig. 12.
Effect of diphenylhydantoin on apoptosis mediated by metabolic inhibition. After a 3-day incubation with control medium, the cells were transferred to medium containing amobarbital and deoxyglucose supplemented with either 0 or 100 μM diphenylhydantoin. After 1 h the cells were examined for the presence of apoptotic cells (TUNEL staining). Values are means ± SE of 4 different preparations. *P < 0.05, significant difference between the metabolically inhibited and uninhibited control. #P < 0.05, significant difference between the metabolically inhibited, diphenylhydantoin-treated group, and uninhibited, diphenylhydantoin-treated group.

Similar articles

References

    1. Allo SN, Bagby L, Schaffer SW. Taurine depletion, a novel mechanism for cardioprotection from regional ischemia. Am J Physiol Heart Circ Physiol 273: H1956–H1961, 1997 - PubMed
    1. Bhardwaj A, Harukuni I, Murphy SJ, Alkayed NJ, Crain BJ, Koehler RC, Hurn PD, Traystman RJ. Hypertonic saline worsens infarct volume after transient focal ischemia in rats. Stroke 31: 1694–1701, 2000 - PubMed
    1. Chan PM, Lim L, Manser E. PAK is regulated by PI3K, PIX, CDC42 and PP2alpha and mediates focal adhesion turnover in the hyperosmotic stress-induced p38 pathway. J Biol Chem 283: 24949–61, 2008 - PMC - PubMed
    1. Costa ADT, Pierre SV, Cohen MV, Downey JM, Garlid KD. cGMP signalling in pre- and post-conditioning: the role of mitochondria. Cardiovasc Res 77: 344–352, 2008 - PubMed
    1. Fearon IM, Randall AD, Perez-Reyes E, Peers C. Modulation of recombinant T-type Ca2+ channels by hypoxia and glutathione. Pflügers Arch 441: 181–188, 2000 - PubMed

Publication types

Substances

LinkOut - more resources