. 2010 Jul 23;285(30):23496-505.
doi: 10.1074/jbc.M110.117481. Epub 2010 May 26.

Angiotensin-converting enzyme inhibition down-regulates the pro-atherogenic chemokine receptor 9 (CCR9)-chemokine ligand 25 (CCL25) axis

Affiliations

Angiotensin-converting enzyme inhibition down-regulates the pro-atherogenic chemokine receptor 9 (CCR9)-chemokine ligand 25 (CCL25) axis

Joshua Abd Alla et al. J Biol Chem. .

Abstract

Many experimental and clinical studies suggest a relationship between enhanced angiotensin II release by the angiotensin-converting enzyme (ACE) and the pathophysiology of atherosclerosis. The atherosclerosis-enhancing effects of angiotensin II are complex and incompletely understood. To identify anti-atherogenic target genes, we performed microarray gene expression profiling of the aorta during atherosclerosis prevention with the ACE inhibitor, captopril. Atherosclerosis-prone apolipoprotein E (apoE)-deficient mice were used as a model to decipher susceptible genes regulated during atherosclerosis prevention with captopril. Microarray gene expression profiling and immunohistology revealed that captopril treatment for 7 months strongly decreased the recruitment of pro-atherogenic immune cells into the aorta. Captopril-mediated inhibition of plaque-infiltrating immune cells involved down-regulation of the C-C chemokine receptor 9 (CCR9). Reduced cell migration correlated with decreased numbers of aorta-resident cells expressing the CCR9-specific chemoattractant factor, chemokine ligand 25 (CCL25). The CCL25-CCR9 axis was pro-atherogenic, because inhibition of CCR9 by RNA interference in hematopoietic progenitors of apoE-deficient mice significantly retarded the development of atherosclerosis. Analysis of coronary artery biopsy specimens of patients with coronary artery atherosclerosis undergoing bypass surgery also showed strong infiltrates of CCR9-positive cells in atherosclerotic lesions. Thus, the C-C chemokine receptor, CCR9, exerts a significant role in atherosclerosis.


Figures
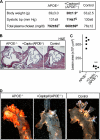
FIGURE 1.
FIGURE 1.
Captopril inhibits atherosclerosis development of apoE-deficient mice. A, characteristic parameters of the three study groups, i.e. untreated apoE-deficient (APOE−/−), captopril-treated apoE-deficient (+Captopril, APOE−/−), and non-transgenic C57BL/6J control (Control) mice (age 32–34 weeks). Data represent mean ± S.D., n = 5 mice/group; *, p < 0.01 (APOE−/− versus Captopril); §, p < 0.05 (APOE−/− versus Captopril); †, p < 0.05 (APOE−/− versus Control); #, p < 0.05 (Captopril versus Control); analysis of variance with Dunn's multiple comparison test. B, representative hematoxylin-eosin (H & E)-stained sections representing the mean aortic root lesion area of 32–34-week-old apoE-deficient (APOE−/−, left panel), captopril-treated apoE-deficient (+Capto., apoE−/−, middle panel), and non-transgenic C57BL/6J control (Control; right panel) mice demonstrate that captopril suppressed atherosclerotic plaque formation of apoE-deficient mice (bar, 500 μm). C, quantification of the atherosclerotic lesion area in the aortic root of 32–34-week-old untreated apoE-deficient (APOE−/−) and captopril-treated apoE-deficient (+Capto., APOE−/−) mice; n = 5 mice/group; ***, p < 0.0001. D, representative Oil-red O-staining of atherosclerotic plaques in the aortic arch of an untreated apoE-deficient mouse (APOE−/−, left panel) relative to captopril-treated apoE-deficient (+Captopril, APOE−/−, middle panel) and non-transgenic C57BL/6J control (Control, right panel) mice.
FIGURE 2.
FIGURE 2.
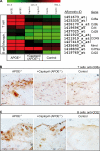
Microarray analysis reveals infiltrating immune cells in the aorta of apoE-deficient mice. A, normalized signal intensity values of differentially expressed probe sets detecting immune cell-specific markers in the aortas of captopril-treated apoE-deficient (+Captopril, APOE−/−) relative to untreated apoE-deficient (APOE−/−) mice are presented as a heat map centered to the median value. Probe sets of captopril-treated mice, which showed (i) a significantly different signal intensity value relative to untreated apoE-deficient mice (p < 0.05), (ii) a more than 50% reduction of signal intensity relative to untreated apoE-deficient mice, (iii) membrane localization, and (iv) immune cell specificity are listed. As a control, the B cell-specific probe sets of Cd79a and Cd22 were also included, which are not different between captopril-treated and untreated apoE-deficient mice. For comparison, all immune cell markers were significantly different between non-transgenic C57BL/6J control mice (Control) and apoE-deficient mice (p < 0.05). B, immunohistology analysis of infiltrating T cells in aortic root sections of an apoE-deficient (APOE−/−, left panel), captopril-treated apoE-deficient (+Captopril, APOE−/−, middle panel), and non-transgenic C57BL/6J control (Control, right panel) mouse was performed with anti-CD8a antibodies. C, detection of infiltrating B cells by immunohistology of aortic root sections of an apoE-deficient (APOE−/−, left panel), captopril-treated apoE-deficient (+Captopril, apoE−/−, middle panel), and non-transgenic C57BL/6J control (Control, right panel) mouse was performed with CD22-specific (anti-CD22) antibodies (bar, 20 μm). Immunohistology data are representative of at least 3 different mice per group (B and C).
FIGURE 3.
FIGURE 3.
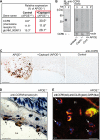
Captopril suppresses the recruitment of CCR9-positive immune cells into the aorta of apoE-deficient mice. A, microarray data showing down-regulation of aortic Ccr9 expression of captopril-treated apoE-deficient mice (+Captopril; APOE−/−) relative to untreated apoE-deficient mice (APOE−/−). For comparison, the decreased signal intensities of the Ccr9-specific probe sets of non-transgenic C57BL/6J control mice (Control; APOE+/+) are also presented. Relative expression values of the Ccr9-specific probe sets are presented as % of apoE−/−, i.e. 100% (*, p < 0.04). B, immunoblot (IB) detection of the CCR9 protein (IB, anti-CCR9) was performed with affinity-purified CCR9-specific antibodies on HEK cell membranes, transfected with (+) and without (−) a plasmid encoding CCR9 (lanes 1 and 2), and on aortic membranes isolated from an untreated apoE-deficient (APOE−/−; Untreat., lane 3), a captopril-treated apoE-deficient (APOE−/−; Capto., lane 4), and a non-transgenic C57BL/6J control (APOE+/+; Cont., lane 5) mouse, respectively. Immunoblot data are representative of 4 different mice/group. Lane P is a specificity control showing an immunoblot of aortic membranes from an apoE-deficient mouse and pre-absorption of the antibodies with the antigen used for immunization. The lower panel shows an immunoblot of β-actin demonstrating equal protein loading. C, immunohistology detection of CCR9 with affinity-purified CCR9-specific antibodies on aortic root sections of apoE-deficient (APOE−/−, left panel), captopril-treated apoE-deficient (+Captopril; APOE−/−, middle panel), and non-transgenic C57BL/6J control (Control, right panel) mice (bar, 100 μm). D, immunohistology detection of CCR9-positive cells (marked by arrows) docking to the aortic intima (with atherosclerotic plaque, Pl) from the side of the aortic lumen (Lu) of an apoE-deficient mouse (APOE−/−). The aortic root section was counterstained with hematoxylin (bar, 20 μm). E, CCR9-positive cells in the aortic root section (with atherosclerotic plaque, Pl) of an apoE-deficient mouse (APOE−/−) were detected by immunofluorescence with affinity-purified, rat anti-CCR9 antibodies followed by F(ab)2 fragments of Alexa Fluor 546-labeled secondary antibodies (red). The presence of CCL25 was detected with affinity-purified, rabbit anti-CCL25 followed by F(ab)2 fragments of Alexa Fluor 488-labeled secondary antibodies (green). Cell nuclei were stained with DAPI (blue). Arrows point to multinucleated CCR9-positive foam cells. Autofluorescence marks internal elastic lamina (bar, 20 μm). Immunohistology/immunofluorescence data are representative of at least 3 different mice/group (C–E).
FIGURE 4.
FIGURE 4.
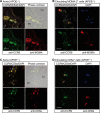
CCR9 localization on plaque-resident macrophages and circulating monocytes. A, localization of CCR9 on MOMA-2-positive macrophages/foam cells of the aortic root of an apoE-deficient mouse (APOE−/−). Aortic lumen (Lu) and plaque area (Pl) are indicated on the phase-contrast image (right upper panel, overlay CCR9/MOMA-2). B, circulating MOMA-2-positive monocytes of apoE-deficient mice are also CCR9-positive. C, the CCR9 protein is localized on CD8a positive cells of the aortic root of apoE-deficient mice. Aortic lumen (Lu) and plaque area (Pl) are indicated on the phase-contrast image (right upper panel, overlay CCR9/CD8a/DAPI). D, circulating CD8a-positive cells are CCR9-positive. CCR9-positive cells were detected by immunofluorescence on aortic cryosections (A and C) or circulating cells (B and D) with affinity-purified, rabbit anti-CCR9 antibodies (anti-CCR9) followed by F(ab)2 fragments of Alexa Fluor 488-labeled secondary antibodies (green, A–D). The presence of the monocyte-macrophage-specific marker, MOMA-2, was detected with rat anti-MOMA-2 antibodies (anti-MOMA) followed by F(ab)2 fragments of Alexa Fluor 546-labeled secondary antibodies (red, A and B). CD8a-positive cells were identified by rat anti-CD8a antibodies (anti-CD8a) followed by F(ab)2 fragments of Alexa Fluor 546-labeled secondary antibodies (red, C and D). Cell nuclei were stained with DAPI (blue, A–D; bar, 20 μm). Immunofluorescence data are representative of at least 3 different mice.
FIGURE 5.
FIGURE 5.
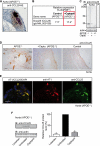
Captopril reduces plaque-resident CCL25-positive cells. A, immunohistology detection of CCL25 on an aortic root section of an apoE-deficient mouse (APOE−/−) was performed with affinity-purified anti-CCL25 antibodies (anti-CCL25) visualizing CCL25 adjacent to a necrotic center. Cell nuclei were stained with hematoxylin (HE; bar, 20 μm). B, microarray data reveal down-regulation of aortic Ccl25 expression by captopril treatment (+Captopril; APOE−/−) relative to untreated apoE-deficient (APOE−/−) mice. For comparison, the relative signal intensity of the Ccl25-specific probe set of non-transgenic C57BL/6J control mice (Control, APOE+/+) is also presented. The relative expression values of the probe set are presented as % of apoE−/−, i.e. 100% (*, p ≤ 0.01). C, immunoblot detection of CCL25 with affinity-purified CCL25-specific antibodies (IB: anti-CCL25) in aortic tissue isolated from an untreated apoE-deficient mouse (−/−; −), a captopril-treated apoE-deficient mouse (−/−; +Capto.), or an untreated non-transgenic C57BL/6J control mouse (+/+; −). Lane P is a specificity control showing an immunoblot of aortic tissue from apoE-deficient mice and pre-absorption of the antibodies with the antigen used for immunization. The lower panel shows an immunoblot of β-actin demonstrating equal protein loading. The immunoblots are representative of 4 different mice/group. D, immunohistology detection of CCL25 with affinity-purified CCL25-specific antibodies (anti-CCL25) on aortic root sections of apoE-deficient (APOE−/−, left panel), captopril-treated apoE-deficient (+Captopril; APOE−/−, middle panel), and non-transgenic C57BL/6J control mice (Control, right panel). Lumen (Lu) and plaque (Pl) area are indicated, bar, 20 μm. E, immunofluorescence detection of CCL25 on plaque-resident cells of an apoE-deficient mouse. CCL25 was detected with affinity-purified, rat anti-CCL25 antibodies followed by F(ab)2 fragments of Alexa Fluor 488-labeled (green) secondary antibodies (left/right panels). The CCL25-positive cells co-localized with AT1, which was detected with affinity-purified, rabbit anti-AT1 antibodies followed by F(ab)2 fragments of Alexa Fluor 546-labeled (red) secondary antibodies (left/middle panels). Cell nuclei were stained with DAPI (blue, left panel) (bar, 20 μm). Immunohistology/immunofluorescence data are representative of at least 3 different mice/group (A, D, and E). F, immunoblot detection of CCL25 with affinity-purified CCL25-specific antibodies (IB, anti-CCL25) in aortic tissue isolated from losartan-treated (Losartan), untreated (Untreated), and captopril-treated (Captopril) apoE-deficient mice (n = 3 mice/group). The lower panel is a control immunoblot detecting β-actin (IB, anti-actin). The right panel shows quantification of the relative CCL25 protein levels by densitometric immunoblot scanning (Untreated, 100%). Data represent mean ± S.D., n = 3 mice/group; *, p < 0.0004.
FIGURE 6.
FIGURE 6.
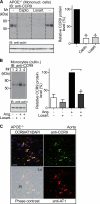
Inhibition of ACE-dependent angiotensin II AT1 receptor activation reduces CCR9 protein levels of circulating mononuclear cells. A, immunoblot (IB) detection of CCR9 (IB, anti-CCR9) on mononuclear cell membranes (Mononucl. cells) isolated from 32-week-old untreated apoE-deficient mice (−), captopril-treated (Capto.), and losartan-treated (Losart.) apoE-deficient mice (n = 4 mice/group). The lower panel is a control immunoblot of β-actin (IB: anti-actin) demonstrating equal protein loading. The right panel shows quantification of the relative CCR9 protein levels by densitometric immunoblot scanning (Untreated,−; 100%). Data represent mean ± S.D., n = 4 mice/group; *, p < 0.001. B, immunoblot detection of CCR9 (IB, anti-CCR9) on cultivated monocytes (cultiv.) isolated from apoE-deficient mice. Cultivated monocytes were incubated for 30 h in the absence (−) or presence (+) of angiotensin II (Ang; 50 nm), and/or losartan (Losart.; 5 μm; added 30 min before angiotensin II) as indicated. The left panel shows a representative immunoblot, and the right panel shows quantification of the relative CCR9 protein levels by densitometric immunoblot scanning of three independent experiments (Ang,+; 100%). Data represent mean ± S.D., n = 3; *, p < 0.01. C, immunofluorescence reveals co-localization of CCR9 and AT1 on plaque-resident cells of apoE-deficient mice. CCR9 was detected with affinity-purified, rat anti-CCR9 (anti-CCR9) antibodies followed by F(ab)2 fragments of Alexa Fluor 488-labeled (green) secondary antibodies. Detection of the AT1 receptor was performed with affinity-purified anti-AT1 antibodies from rabbit (anti-AT1) followed by Alexa Fluor 546-labeled (red) secondary antibodies. Cell nuclei were stained with DAPI (blue). The lumen (Lu) and plaque (Pl) areas are indicated on the phase-contrast image (overlay CCR9/AT1/DAPI), bar, 20 μm. Immunofluorescence data are representative of 3 different mice.
FIGURE 7.
FIGURE 7.
Inhibition of CCR9 in hematopoietic progenitors retards atherosclerosis development of apoE-deficient mice. A, immunoblot (IB) quantification of relative CCR9, CCR6, and CCR7 protein levels on membranes of the receptor-expressing NIH-3T3 cells transduced with a control lentivirus (Con-RNAi; 100%) or with lentiviral-mediated RNAi inhibition of Ccr9 (CCR9-RNAi). Data represent mean ± S.D., n = 4; *, p < 0.0001. B, immunoblot detection of CCR9 with affinity-purified anti-CCR9 antibodies (IB: anti-CCR9) on membranes of circulating mononuclear cells (Mononucl. cells) isolated from apoE-deficient mice (APOE−/−) with lentiviral-mediated RNAi inhibition of Ccr9 in hematopoietic progenitors (CCR9-RNAi) relative to apoE-deficient mice transplanted with cells transduced with a control lentivirus (Con-RNAi); n = 5 mice/group. C, immunoblot detection of CCR9 (IB: anti-CCR9) on membranes of circulating mononuclear cells isolated from 28-week-old untreated apoE-deficient mice (Untreat., APOE−/−), captopril-treated apoE-deficient mice (Capto., APOE−/−), and untreated non-transgenic C57BL/6J control mice (Cont., APOE+/+); n = 2 mice/group. B and C, lower panels show immunoblots of β-actin demonstrating equal protein loading (IB: anti-actin). D, quantification of relative aortic CCR9 protein levels of apoE-deficient mice (APOE−/−) with lentiviral-mediated RNAi inhibition of CCR9 in hematopoietic progenitors (CCR9-RNAi) relative to apoE-deficient mice transplanted with cells transduced with a control lentivirus (Con-RNAi; 100%) by densitometric immunoblot scanning. As a control, aortic CCR9 protein levels were quantified of age-matched, untreated APOE-deficient mice (Untreated; 100%), captopril-treated APOE-deficient mice (Captopril, 4 months of treatment), losartan-treated apoE-deficient mice (Losartan, 4 months of treatment), and non-transgenic C57BL/6J control mice (Control, APOE+/+). Data represent mean ± S.D., n = 5 mice/group; *, p < 0.001. E, Oil-red O staining of the aorta revealed a significantly decreased atherosclerotic plaque area upon lentiviral-mediated RNAi inhibition of Ccr9 in hematopoietic progenitors (CCR9-RNAi) relative to apoE-deficient mice receiving transplantation of cells transduced with a control lentivirus (Con-RNAi). F, quantification of the atherosclerotic lesion area was performed by quantitative image analysis of the Oil-red O-stained lesion area of the aorta. Data are reported as the percent of the aortic surface area covered by lesions of apoE-deficient mice with lentiviral-mediated RNAi inhibition of Ccr9 in hematopoietic progenitors (CCR9-RNAi), and apoE-deficient mice receiving transplantation of control lentivirus-transduced cells (Con-RNAi); *, p < 0.001 (n = 5). G, body weight, systolic blood pressure, and total plasma cholesterol were not significantly different between 28-week-old apoE-deficient (APOE−/−) mice with lentiviral-mediated inhibition of CCR9 in hematopoietic progenitors (CCR9-RNAi), and apoE-deficient mice transplanted with cells transduced with a control lentivirus (Con-RNAi). Data represent mean ± S.D., n = 5 mice/group.
FIGURE 8.
FIGURE 8.
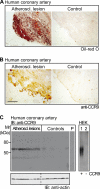
Infiltrates of CCR9-positive cells in atherosclerotic lesions of patients with coronary artery disease. A, atherosclerotic lesions of human coronary artery biopsy specimens from patients undergoing coronary artery bypass surgery were identified by positive Oil-red O staining of cryosections (left versus right panel). B, coronary artery biopsy specimens with atherosclerotic lesions showed strong infiltration of CCR9-positive cells (left panel), whereas CCR9 was almost undetectable on vessel specimens without Oil-red O-positive lesions (right panel). A and B, immunohistology data are representative of 6 different patients each (bar, 100 μm). C, the left panel shows immunoblot (IB) detection of CCR9 (IB: anti-CCR9) on membranes of coronary artery biopsy specimens with atherosclerotic lesions (Atheroscl. lesions; n = 8) relative to control specimens without atherosclerotic lesions (Controls; n = 7) obtained from patients undergoing coronary artery bypass surgery. As a control, pre-absorption of the antibodies by the immunizing antigen abolished the specific staining (lane P). The lower panel shows a control immunoblot detecting β-actin (IB: anti-actin). The right panel represents an immunoblot detection of CCR9 with affinity-purified CCR9-specific antibodies pre-absorbed to human proteins on membranes of human embryonic kidney cells (HEK) overexpressing CCR9 (lane 1, +) compared with mock-transfected cells (lane 2, −).

Similar articles

Cited by

References

    1. Lonn E., Yusuf S., Dzavik V., Doris C., Yi Q., Smith S., Moore-Cox A., Bosch J., Riley W., Teo K.SECURE Investigators (2001) Circulation 103, 919–925 - PubMed
    1. Olsen M. H., Wachtell K., Neland K., Bella J. N., Rokkedal J., Dige-Petersen H., Ibsen H. (2005) Blood Press 14, 177–183 - PubMed
    1. Yusuf S., Sleight P., Pogue J., Bosch J., Davies R., Dagenais G. (2000) New. Engl. J. Med. 342, 145–153 - PubMed
    1. Stumpe K. O., Agabiti-Rosei E., Zielinski T., Schremmer D., Scholze J., Laeis P., Schwandt P., Ludwig M.MORE study investigators (2007) Ther. Adv. Cardiovasc. Dis. 1, 97–106 - PubMed
    1. Wassmann S., Czech T., van Eickels M., Fleming I., Böhm M., Nickenig G. (2004) Circulation 110, 3062–3067 - PubMed

Publication types

MeSH terms