. 2010 May 17;5(5):e10665.
doi: 10.1371/journal.pone.0010665.

Integrin alpha5beta1 function is regulated by XGIPC/kermit2 mediated endocytosis during Xenopus laevis gastrulation

Affiliations

Integrin alpha5beta1 function is regulated by XGIPC/kermit2 mediated endocytosis during Xenopus laevis gastrulation

Erin Spicer et al. PLoS One. .

Erratum in

Abstract

During Xenopus gastrulation alpha5beta1 integrin function is modulated in a temporally and spatially restricted manner, however, the regulatory mechanisms behind this regulation remain uncharacterized. Here we report that XGIPC/kermit2 binds to the cytoplasmic domain of the alpha5 subunit and regulates the activity of alpha5beta1 integrin. The interaction of kermit2 with alpha5beta1 is essential for fibronectin (FN) matrix assembly during the early stages of gastrulation. We further demonstrate that kermit2 regulates alpha5beta1 integrin endocytosis downstream of activin signaling. Inhibition of kermit2 function impairs cell migration but not adhesion to FN substrates indicating that integrin recycling is essential for mesoderm cell migration. Furthermore, we find that the alpha5beta1 integrin is colocalized with kermit2 and Rab 21 in embryonic and XTC cells. These data support a model where region specific mesoderm induction acts through kermit2 to regulate the temporally and spatially restricted changes in adhesive properties of the alpha5beta1 integrin through receptor endocytosis.


Conflict of interest statement

Competing Interests: The authors have declared that no competing interests exist.

Figures

Figure 1
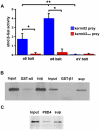
Figure 1. Kermit2 interacts with the cytoplasmic domain of the α5 and α6 integrin subunits.
(A) Yeast two two-hybrid assays were conducted using α5, α6 and αV cytoplasmic domains as bait in combination with kermit2 or kermit2mut as prey. The data is presented as average normalized β-galactosidase activity (±SD). The interaction of kermit2 with α5 and α6 is abolished by the AEEL mutation in kermit2mut (* P<0.002). The αV subunit does not interact with kermit2 or kermit2mut (** indicates P<0.001 between α5 or α6 and αV bait constructs). (B) GST pulldowns. HA tagged Kermit2 is detected in lysates (lane 1 input), and is pulled down with a GST-α5 fusion construct (lane 2 GST-α5). Most of the kermit2 remains in the supernatant (lane 3 sup). A control GST-β1 construct (lane 5 GST-β1) does not pull Kermit2 from lysates (lane 4 input, lane 6 sup). (C) Coimmunoprecipitation of kermit2 with α5β1 integrin. HA tagged kermit2 is detected in lysates (lane 1 input). Kermit2 is found in association with immunoprecipitated α5β1 (lane 2 P8D4), while a significant portion of kermit2 remains in the supernatant (sup).
Figure 2
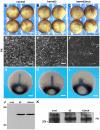
Figure 2. Kermit2mut inhibits Xenopus gastrulation.
(A) Control embryos injected with water close their blastopores and (D) assemble a dense FN matrix. (B) Embryos injected with kermit2 also gastrulate and (E) assemble FN matrix normally. (C) Embryos injected with kermit2mut mRNA fail to close the blastopore and (F) have a sparse FN matrix. (G–I) Xbra in situ hybridizations indicate normal mesodermal patterning in (G) control embryos, as well as (H) embryos expressing kermit2, and in embryos expressing (I) kermit2mut. Note that axial extension is inhibited in (I). (J) Western blot demonstrating equal expression of HA tagged kermit2 and kermit2 constructs. Embryos injected with water (cont) do not express the construct, while embryos injected with RNA encoding kermit2 (k2) and kermit2mut (k2mut) express equal amounts of either construct. Molecular mass markers are indicated on the right of the panel. (K) Kermit2mut expression does not inhibit FN protein accumulation. Western blots demonstrate that there is no substantial change in FN protein expression (FN) in water injected embryos (cont), embryos expressing kermit2 (k2), or embryos expressing kermit2mut (k2mut). Molecular mass markers are indicated on the right of the panel. (A–C) size marker  = 200 µM. (D–F) size marker  = 30 µM. (G–I) size marker 100 µM.
Figure 3
Figure 3. Animal cap assays (A, C, E) minus activin or (B, D, F) plus activin.
(A, B) Control activin-treated animal caps extend. (C, D) Kermit2 has no effect on activin-treated animal cap extension. (E, F) Kermit2mut inhibits activin-treated animal cap elongation. Size marker  = 100 µM.
Figure 4
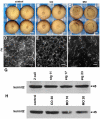
Figure 4. Morpholino knock down of kermit2 inhibits gastrulation and FN matrix assembly.
(A–C) Ventral view of stage 12 embryos. (D–F) Late gastrula stage BCR stained for FN. (A) Stage 12 control embryos gastrulate normally and (D) assemble a dense FN matrix. Embryos injected with 20 ng of Kermit2 5 mismatch control morpholino (COMO; B) gastrulate normally, and (E) exhibit a small decrease in FN matrix assembly. (C) Embryos injected with kermit2 inhibiting morpholino (MO) exhibit delayed blastopore closure and (F) a sparse FN matrix network. (G) Western blot of kermit2 expression. Kermit2 is expressed throughout early development. (H) Morpholino knock down of kermit2 in stage 11 embryos. 30 ng of control morpholino (CO 30) has no effect on Kermit2 expression. The Kermit morpholino at 10 ng and 20 ng (MO 10 and MO 20) decreases kermit2 expression below control levels. Molecular mass is indicated to the left of the panel. (A–C) size marker  = 200 µm. (D–F) size marker  = 30 µm.
Figure 5
Figure 5. Expression of kermit2 mRNA rescues morpholino knock down of kermit2.
(A–D) Ventral view of stage 12 embryos. (E–H) Late gastrula stage BCR stained for FN. (A) Stage 12 control embryos gastrulate normally and (E) assemble a dense FN matrix. Embryos injected with 10 ng of Kermit2 morpholino (MO; B) gastrulate normally, and (F) exhibit a small decrease in FN matrix assembly. (C) Embryos injected with kermit2 inhibiting morpholino and kermit2 mRNA (MO+kermit2) exhibit a small delay in blastopore closure and (G) a partial rescue of FN matrix assembly. (D) Embryos injected with the kermit2 morpholino and the dominant negative kermit2 construct (MO+kermit2mut) exhibit delayed blastopore closure and (H) significant reduction in FN matrix assembly. (A–D) size marker  = 200 µm. (E–H) size marker  = 30 µm.
Figure 6
Figure 6. Inhibition of FN matrix assembly is not due to IGF signaling.
(A, B) Control embryos close the blastopore by stage 12 and elaborate a dense FN matrix. (C, D) Embryos expressing a dominant negative IGFR-1 construct (dnIGFR-1) appear similar to control embryos and elaborate a dense FN matrix. (E) Xbra expression in control embryos. (F) Xbra patterning is not altered by blocking IGF signaling. There is a minor effect on axial extension that is clearly revealed in tadpoles (G) Control tadpoles (top) are longer than tadpoles resulting from embryos expressing dnIGFR-1 (middle). The dnIGFR-1 construct results in anterior defects including reduced or absent eyes (arrowhead). Tadpoles obtained from embryos that express kermit2mut show severe anterior truncations and mesodermal defects (bottom). (H) Western blots demonstrating inhibition of IGF signaling by the dnIGFR-1 construct. The phosphorylation of Akt (pAkt) seen in controls (cont) is not maintained in animal caps that express the dominant negative IGFR-1 construct (dnIGFR). Bottom panel shows total Akt expression in the same lysate. Molecular mass is indicated to the left of the panel.
Figure 7
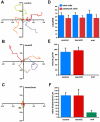
Figure 7. Cell adhesion assays.
(A–C) Spider graphs representing migration tracks of individual cells plated on FN substrates. Each graph contains 4 representative tracks with the start point set to (0,0). Horizontal and vertical scale is in µM. (C) Kermit2mut expressing cells have reduced migration paths as compared to (A) control and (B) kermit2 expressing cells. (D) Quantification of activin-treated cell adhesion to FN substrates. Cells were plated on FN substrates and counted pre-wash (blue) and after washing to remove non-adherent cells (red). Control, kermit2, and kermit2mut expressing cells all show similar affinity for FN substrates. (E) Activin-treated cell migration rate mediated by kermit2. Average cell migration velocities were measured using the track cells function of Openlab. The value for each construct represents the average (±SD) of 45 cells from three spawnings. Cells expressing the kermit2mut construct (0.6 µM/hr) migrate significantly (P<0.005) slower than control (91 µM/hr) or kermit2 (97 µM/hr) expressing cells. (F) The radial displacement of activin-treated cells on FN substrates. Measurements are from the same cells as represented in (E). Kermit2mut expressing cells travel significantly (P<0.01) less distance (32 µM) than control (148 µM) or kermit2 expressing cells (147 µM).
Figure 8
Figure 8. Kermit2 regulates internalization of antibody bound α5β1 integrin.
Xenopus A6 cells were transfected with (A) GFP-tagged kermit2, or (B) GFP-tagged kermit2mut and the endocytosis of antibody labeled α5β1 was estimated from fluorescent intensity using the density slice function of Openlab. (C, D) Staining of internalized α5β1 with fluorescent anti-mouse antibody. Non-transfected cells in the same dish act as controls. Insets in C and D represent 25 µM2 ROI's used to estimate pixel densities. (A, C) Kermit2 transfected cells have 827.3±23.0 pixels/ROI as compared to control cell ROI pixel densities of 841.5±13.3 pixels/ROI. (B, D) In kermit2mut transfected cells the ROI pixel density is 530.8±51.2, while in non-transfected cells from the same dish have an average pixel density of 832.5±24.3 pixels/ROI. Pixel densities represent averages (±SD) from 10 individual cells from 4 separate transfections. Size marker  = 25 µM.
Figure 9
Figure 9. Endocytosis of α5β1 integrin.
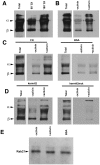
Cell surface α5β1 integrin was labeled with cleavable biotin and endocytosed integrin was immunoprecipitated and integrin subunits detected with streptavidin HRP on non-reducing western blots. α and β subunits are indicated to the left of the panels. The non-reduced P8D4 IgG used for the immunoprecipitation runs at the same molecular weight as the α subunit partially masking the signal. In all panels the total lane represents five fold more cells than represented in other lanes and the samples were not surface stripped. (A) Time course of α5β1 integrin endocytosis following activin induction. Increasing amounts of α5β1 are found in the cytoplasm at 60 minutes and 180 minutes following activin treatment. (B) α5β1 integrin endocytosis is stimulated by activin induction. Panels A&B come from the same gel and are separated for clarity. (C) Cell adhesion stimulates α5β1 endocytosis. Activin-tretaed cells adherent on FN substrates exhibit an increased rate of endocytosis as compared to cells on a non-adherent (BSA) substrate. (D) Kermit2 regulates α5β1 endocytosis. Activin-treated kermit2mut expressing cells show reduced levels of α5β1 integrin endocytosis as compared to cells expressing kermit2. (E) Rab 21 coprecipitates with α5β1 integrin independent of mesoderm induction and adhesive substrate. Rab 21 was detected in α5β1 immunoprecipitates with A-14 antibody.
Figure 10
Figure 10. Colocalization of α5β1, kermit2, and Rab 21 in Xenopus embryonic cells.
Activin-treated embryonic cells were plated on FN substrates and stained for α5β1 (green), or kermit2 (red D), or Rab 21 (red H). (A, E) DIC images of adherent cells, boxes represent areas magnified in B–D and F–H. (A–D) Integrin (C; green) and kermit2 (D; red) colocalize at sites of adhesion (arrowheads in B–D). (E–H) Rab 21 (H; red) and integrin (G; green) colocalize in embryonic cells (arrowheads in F–H). Staining of cells with secondary antibodies alone produced no detectable signal. Size marker  = 25 µM.
Figure 11
Figure 11. Colocalization of α5β1, kermit2, and Rab 21 in Xenopus XTC cells.
XTC cells were stained for α5β1 (green), or kermit2 (red D), or Rab 21 (red H). (A, E) DIC images of adherent cells, boxes represent areas magnified in B–D and F–H. (A–D) Integrin (C; green) and kermit2 (D; red) colocalize in numerous vesicles and at focal adhesions (arrowheads in B–D). (E–H) Rab 21 (H; red) and integrin (G; green) colocalize in cytoplasmic vesicles and focal adhesions (arrowheads in F–H). Staining of cells with secondary antibodies alone produced no detectable signal. Size marker  = 25 µM.

Similar articles

Cited by

References

    1. Hynes RO. Integrins: bidirectional, allosteric signaling machines. Cell. 2002;110:673–687. - PubMed
    1. Banno A, Ginsberg MH. Integrin activation. Biochem Soc Trans. 2008;36:229–234. - PMC - PubMed
    1. Pellinen T, Ivaska J. Integrin traffic. J Cell Sci. 2006;119:3723–3731. - PubMed
    1. Lee G, Hynes R, Kirschner M. 1984;36:729–740. Temporal and spatial regulation of fibronectin in early Xenopus development. - PubMed
    1. Ramos JW, DeSimone DW. Xenopus embryonic cell adhesion to fibronectin: position-specific activation of RGD/synergy site-dependent migratory behavior at gastrulation. J Cell Biol. 1996;134:227–240. - PMC - PubMed

Publication types

MeSH terms