Update of the CHARMM all-atom additive force field for lipids: validation on six lipid types
- PMID: 20496934
- PMCID: PMC2922408
- DOI: 10.1021/jp101759q
Update of the CHARMM all-atom additive force field for lipids: validation on six lipid types
Abstract
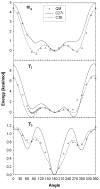
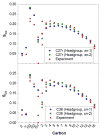
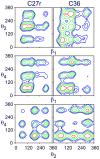
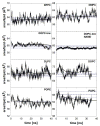
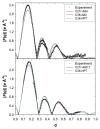
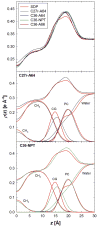
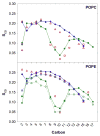
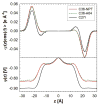
A significant modification to the additive all-atom CHARMM lipid force field (FF) is developed and applied to phospholipid bilayers with both choline and ethanolamine containing head groups and with both saturated and unsaturated aliphatic chains. Motivated by the current CHARMM lipid FF (C27 and C27r) systematically yielding values of the surface area per lipid that are smaller than experimental estimates and gel-like structures of bilayers well above the gel transition temperature, selected torsional, Lennard-Jones and partial atomic charge parameters were modified by targeting both quantum mechanical (QM) and experimental data. QM calculations ranging from high-level ab initio calculations on small molecules to semiempirical QM studies on a 1,2-dipalmitoyl-sn-phosphatidylcholine (DPPC) bilayer in combination with experimental thermodynamic data were used as target data for parameter optimization. These changes were tested with simulations of pure bilayers at high hydration of the following six lipids: DPPC, 1,2-dimyristoyl-sn-phosphatidylcholine (DMPC), 1,2-dilauroyl-sn-phosphatidylcholine (DLPC), 1-palmitoyl-2-oleoyl-sn-phosphatidylcholine (POPC), 1,2-dioleoyl-sn-phosphatidylcholine (DOPC), and 1-palmitoyl-2-oleoyl-sn-phosphatidylethanolamine (POPE); simulations of a low hydration DOPC bilayer were also performed. Agreement with experimental surface area is on average within 2%, and the density profiles agree well with neutron and X-ray diffraction experiments. NMR deuterium order parameters (S(CD)) are well predicted with the new FF, including proper splitting of the S(CD) for the aliphatic carbon adjacent to the carbonyl for DPPC, POPE, and POPC bilayers. The area compressibility modulus and frequency dependence of (13)C NMR relaxation rates of DPPC and the water distribution of low hydration DOPC bilayers also agree well with experiment. Accordingly, the presented lipid FF, referred to as C36, allows for molecular dynamics simulations to be run in the tensionless ensemble (NPT), and is anticipated to be of utility for simulations of pure lipid systems as well as heterogeneous systems including membrane proteins.
Figures




Similar articles
-
Derivation and systematic validation of a refined all-atom force field for phosphatidylcholine lipids.J Phys Chem B. 2012 Mar 15;116(10):3164-79. doi: 10.1021/jp212503e. Epub 2012 Mar 1. J Phys Chem B. 2012. PMID: 22352995 Free PMC article.
-
CHARMM-GUI Input Generator for NAMD, GROMACS, AMBER, OpenMM, and CHARMM/OpenMM Simulations Using the CHARMM36 Additive Force Field.J Chem Theory Comput. 2016 Jan 12;12(1):405-13. doi: 10.1021/acs.jctc.5b00935. Epub 2015 Dec 3. J Chem Theory Comput. 2016. PMID: 26631602 Free PMC article.
-
Drude Polarizable Force Field for Molecular Dynamics Simulations of Saturated and Unsaturated Zwitterionic Lipids.J Chem Theory Comput. 2017 Sep 12;13(9):4535-4552. doi: 10.1021/acs.jctc.7b00262. Epub 2017 Aug 8. J Chem Theory Comput. 2017. PMID: 28731702 Free PMC article.
-
Mechanical properties of lipid bilayers from molecular dynamics simulation.Chem Phys Lipids. 2015 Nov;192:60-74. doi: 10.1016/j.chemphyslip.2015.07.014. Epub 2015 Jul 31. Chem Phys Lipids. 2015. PMID: 26238099 Free PMC article. Review.
-
Structure of lipid bilayers.Biochim Biophys Acta. 2000 Nov 10;1469(3):159-95. doi: 10.1016/s0304-4157(00)00016-2. Biochim Biophys Acta. 2000. PMID: 11063882 Free PMC article. Review.
Cited by
-
Specific PIP2 binding promotes calcium activation of TMEM16A chloride channels.Commun Biol. 2021 Feb 26;4(1):259. doi: 10.1038/s42003-021-01782-2. Commun Biol. 2021. PMID: 33637964 Free PMC article.
-
In silico simulations of erythrocyte aquaporins with quantitative in vitro validation.RSC Adv. 2020;10(36):21283-21291. doi: 10.1039/d0ra03456h. Epub 2020 Jun 4. RSC Adv. 2020. PMID: 32612811 Free PMC article.
-
Location and Conformational Ensemble of Menaquinone and Menaquinol, and Protein-Lipid Modulations in Archaeal Membranes.J Phys Chem B. 2021 May 13;125(18):4714-4725. doi: 10.1021/acs.jpcb.1c01930. Epub 2021 Apr 29. J Phys Chem B. 2021. PMID: 33913729 Free PMC article.
-
Simulation of lipid bilayer self-assembly using all-atom lipid force fields.Phys Chem Chem Phys. 2016 Apr 21;18(15):10573-84. doi: 10.1039/c5cp07379k. Epub 2016 Apr 1. Phys Chem Chem Phys. 2016. PMID: 27034995 Free PMC article.
-
Structure and dynamics of the M3 muscarinic acetylcholine receptor.Nature. 2012 Feb 22;482(7386):552-6. doi: 10.1038/nature10867. Nature. 2012. PMID: 22358844 Free PMC article.
References
-
- Yin DX, MacKerell AD., Jr Journal of Computational Chemistry. 1998;19:334.
-
- Feller SE, MacKerell AD., Jr Journal of Physical Chemistry B. 2000;104:7510.
-
- Klauda JB, Brooks BR, MacKerell AD, Jr, Venable RM, Pastor RW. Journal of Physical Chemistry B. 2005;109:5300. - PubMed
-
- MacKerell AD. Journal of Computational Chemistry. 2004;25:1584. - PubMed
Publication types
MeSH terms
Substances
Grants and funding
LinkOut - more resources
Full Text Sources
Other Literature Sources

