. 2010 May 13;6(5):e1000902.
doi: 10.1371/journal.ppat.1000902.

Muc2 protects against lethal infectious colitis by disassociating pathogenic and commensal bacteria from the colonic mucosa

Affiliations

Muc2 protects against lethal infectious colitis by disassociating pathogenic and commensal bacteria from the colonic mucosa

Kirk S B Bergstrom et al. PLoS Pathog. .

Abstract

Despite recent advances in our understanding of the pathogenesis of attaching and effacing (A/E) Escherichia coli infections, the mechanisms by which the host defends against these microbes are unclear. The goal of this study was to determine the role of goblet cell-derived Muc2, the major intestinal secretory mucin and primary component of the mucus layer, in host protection against A/E pathogens. To assess the role of Muc2 during A/E bacterial infections, we inoculated Muc2 deficient (Muc2(-/-)) mice with Citrobacter rodentium, a murine A/E pathogen related to diarrheagenic A/E E. coli. Unlike wildtype (WT) mice, infected Muc2(-/-) mice exhibited rapid weight loss and suffered up to 90% mortality. Stool plating demonstrated 10-100 fold greater C. rodentium burdens in Muc2(-/-) vs. WT mice, most of which were found to be loosely adherent to the colonic mucosa. Histology of Muc2(-/-) mice revealed ulceration in the colon amid focal bacterial microcolonies. Metabolic labeling of secreted mucins in the large intestine demonstrated that mucin secretion was markedly increased in WT mice during infection compared to uninfected controls, suggesting that the host uses increased mucin release to flush pathogens from the mucosal surface. Muc2 also impacted host-commensal interactions during infection, as FISH analysis revealed C. rodentium microcolonies contained numerous commensal microbes, which was not observed in WT mice. Orally administered FITC-Dextran and FISH staining showed significantly worsened intestinal barrier disruption in Muc2(-/-) vs. WT mice, with overt pathogen and commensal translocation into the Muc2(-/-) colonic mucosa. Interestingly, commensal depletion enhanced C. rodentium colonization of Muc2(-/-) mice, although colonic pathology was not significantly altered. In conclusion, Muc2 production is critical for host protection during A/E bacterial infections, by limiting overall pathogen and commensal numbers associated with the colonic mucosal surface. Such actions limit tissue damage and translocation of pathogenic and commensal bacteria across the epithelium.


Conflict of interest statement

The authors have declared that no competing interests exist.

Figures

Figure 1
Figure 1. Citrobacter rodentium penetrates the colonic mucus layer in vivo.
Staining for GFP-expressing C. rodentium using an antibody that recognizes GFP (green), and murine Muc2 (red), with DAPI (blue) as a counterstain. No GFP-labeled C. rodentium can be seen in the mucus layers of uninfected mice (upper panels), but in infected mice, C rodentium is observed within the outer and inner mucus layer in regions where the underlying epithelium is infected (bottom panels). Right panels “a” and “b” are expanded images of corresponding boxed regions in left panels. o =  outer mucus layer; i  =  inner mucus layer; Cr  =  C. rodentium; GC  =  goblet cell. Original magnification  = 200×. Scale bar  = 50 µm.
Figure 2
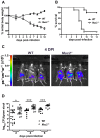
Figure 2. Muc2−/− mice exhibit dramatic susceptibility to C. rodentium-induced morbidity and mortality.
A. Body weights following C. rodentium infection of WT (n = 10) and Muc2−/− (n = 10) mice. Muc2−/− mice rapidly lose weight following C. rodentium infection. Results are representative of 2 independent experiments. B. Survival curve of WT mice (n = 10) and Muc2−/− mice (n = 10) following C. rodentium infection. Results are representative of 3 independent infections, each with 5–10 mice per group. C. Bioluminescent imaging showing WT and Muc2−/− mice at 4 DPI with a luciferase-expressing C. rodentium. The color bar is displayed on the left where red corresponds to the highest signal intensity and blue corresponds to the lowest signal intensity, with corresponding logarithmic units of light measurement (photons s−1 cm−2 seradian−1). Overall signal was significantly greater by 3–10 fold in the Muc2−/− mice vs. WT mice (*P = 0.039, students t-test, 3 mice per group). D. Enumeration of C. rodentium in stool at various times post-infection. Each data point represents one animal. Results are pooled from two separate infections. (2 DPI, *P = 0.013; 4 DPI, ***P<0.0001; 6 DPI, ***P = 0.0004, Mann-Whitney test).
Figure 3
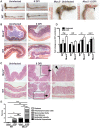
Figure 3. Heightened mucosal damage in Muc2−/− mice is associated with increased pathogen burdens and mucosa-associated bacterial overgrowths.
A. Resected large intestines of uninfected and infected WT and Muc2−/− mice at 6 DPI. Note the shrunken, inflamed cecum of Muc2−/− mice compared to uninfected Muc2−/− mice, as well as the focal ulcers (arrow, right panel). B. H&E stained cecal sections from uninfected and infected WT and Muc2−/− mice at 6 DPI. Inflammation is found throughout the mucosa and submucosa of Muc2−/− mice (top right panel). Original magnification  = 100×. Scale bar  = 100 µm. C. H&E stained sections of descending colons from uninfected and infected WT and Muc2−/− mice at 6 DPI. Diffuse damage is associated with the mucosa of infected Muc2−/− mice. C. rodentium microcolonies can be seen associated with the mucosa in regions of ulceration (arrowhead, top right panel). Original magnification  = 100×. Scale bar  = 100 µm. D. Quantitative PCR results of pro-inflammatory chemokine and cytokine gene expression analysis in the ceca of uninfected or infected mice. Results represent the mean of the averages from 3 independent infections, each with 2–4 mice per group. Error bars  =  SEM. E. Cumulative histologic damage scores from colorectal tissues of WT vs Muc2−/− mice under uninfected and infected conditions. Scores were determined by two independent observers under blinded conditions. Results represent the means of 3–9 experiments with 2–4 mice per group. Error bars  =  SEM (*P<0.05, **P<0.005, *** P<0.0001, Students t test).
Figure 4
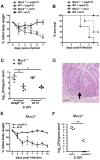
Figure 4. Muc2 deficiency renders mice more susceptible to attenuated strains, but susceptibility is T3SS dependent.
A. Body weights following infection of WT and Muc2−/− mice with wt or ΔespF C. rodentium. n = 5 mice per group. Error bars  =  SEM. B. Survival curve of wt or ΔespF C. rodentium infected WT (n = 5) and Muc2−/− mice (n = 5). ΔespF C. rodentium infection results in comparable mortality to that of wt C. rodentium in Muc2−/− mice. C. Assessment of fecal burden of wt or ΔespF C. rodentium. Each data point represents the value from one individual. Error bars  =  SEM (Muc2−/− + ΔespF Cr vs. WT + ΔespF Cr, *P = 0.0286; Muc2−/− + ΔespF Cr vs. WT + wt Cr, *P = 0.0286, Mann-Whitney test). D. Representative H&E staining of colorectal section from ΔespF C. rodentium-infected Muc2−/− mice. Arrow points to ΔespF C. rodentium microcolony on an ulcerated mucosal surface. Original magnification  = 200×. Scale bar  = 50 µm. E. Analysis of body weights of wt or ΔescN C. rodentium infected Muc2−/− mice. Results are representative of 2 independent infections, with 2–3 mice per group. F. Assessment of fecal burdens of mice in E. Results are pooled from 2 individual experiments with 2–3 mice per group (**P = 0.005, Mann-Whitney test).
Figure 5
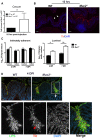
Figure 5. Muc2 limits initial colonization of the mucosal epithelia, but ultimately controls levels of luminal pathogen burdens.
A. Fold differences of intimately adherent C. rodentium numbers present in the ceca of WT vs Muc2−/− mice 10 hours post-injection of 1.5×10⁸ CFU into cecal lumen in a cecal loop surgery experiment (see Material & Methods). Results are of data from a total of 5 mice per group pooled from 2 individual experiments. Error bars  =  SEM (*P = 0.0109, Mann-Whitney test). B. Representative immunostaining for the C. rodentium-specific effector Tir in ceca acquired from cecal loop surgery, 10 hrs post-injection. C. rodentium is found on the surface of Muc2−/− cecal mucosa in a continuous fashion compared to WT mice, where Tir staining is patchy amid long stretches of uncolonized surface epithelium (white arrows). Original magnification, 100×. Scale bar  = 100 µm. C. Quantification of luminal C. rodentium vs. intimately adherent C. rodentium attached to the cecal and colonic mucosa in WT vs. Muc2−/− mice at 4 and 7 DPI. Results represent the mean value pooled from 2 independent infections containing 3–4 mice per group. Error bars  =  SEM (*P = 0.0140; **P = 0.005, Mann-Whitney test). D. Visualization of C. rodentium infection by staining for LPS (green) and Tir (red; red arrowhead), with nuclei specific DAPI (blue).as a counterstain. Tir staining is localized to the surface epithelium in both WT and Muc2−/− mice indicating direct infection, but the majority of LPS-positive cells in Muc2−/− mice are not infecting (Tir-negative), yet are accumulating on the surface of the mucosa. Original magnification, 200×. Scale bar  = 50 µm.
Figure 6
Figure 6. Evidence that Muc2−/− mice do not have intrinsic defects in anti-microbial activity at their mucosal surface.
A. Quantitative PCR analysis of cnlp (encodes mCRAMP) and inos expression in the cecum and rectal tissues of WT and Muc2−/− mice. Results represent the means from 3 independent infections, each with 2–3 animals per group. Error bars  =  SEM. B. Titration curve from a microtitre assay showing crude mucin isolated from colorectal tissues of WT mice contains dose-dependent growth activity on C. rodentium. Assay was performed in duplicate for each dilution. Error bars  =  SEM. Results are representative of 2 independent experiments.
Figure 7
Figure 7. C. rodentium infection results in increased mucin secretion during infection.
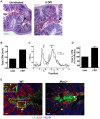
A. Representative PAS/Haematoxylin staining of Carnoy's fixed rectal sections from uninfected (left panel) and C. rodentium-infected mice (right panel). Arrow points to luminal mucus. Original magnification  = 100×. Scale bar  = 100 µm. B. Total counts per minute (CPM) of [3H]-glucosamine labeled glycoproteins found in colorectal secretions 3.5 hrs post-injection from uninfected and infected (6 DPI) WT mice. Results are representative of 2 independent infections containing 5 mice per group. C. Plot of liquid scintillation counts of fractions containing [3H] activity after total secretions were subjected to gel filtration on a Sepharose 4B chromatography column. This graph is representative of 2 independent infections with 5 mice per group. D. Graph of total CPMs of void volumes of S4B-fractionated mucins as described in D. Data represents the mean of the average of 2 independent experiments, each with 5 mice per group. Error bars  =  SEM. E. Combined epifluorescent staining for mucus using the lectin UEA-1 (red), and C. rodentium LPS (green), and cellular DNA (blue) using DAPI as a counterstain in heavily infected (6 DPI) regions of the colorectal mucosa from WT and Muc2−/− mice, as indicated. Individual C. rodentium (arrowhead, inset “a”) can be seen in mucus overlying a single layer of C. rodentium on the mucosal surface of a WT mouse. A C. rodentium microcolony (white arrow) can be seen in vicinity of a Muc2/mucus-deficient environment as indicated by the absence of mucus in the crypt lumens in Muc2−/− mice compared to WT mice (yellow arrow). Original magnification  = 200×. Scale bar  = 50 µm.
Figure 8
Figure 8. Increased luminal load of both pathogenic and non-pathogenic bacteria in Muc2−/− mice during infection.
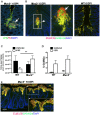
A. Immunofluorescence staining for C. rodentium LPS and DAPI in Muc2−/− at 4 DPI Notice DAPI-stained bacteria that are negative for LPS in the C. rodentium microcolonies (arrow). Original magnification  = 200×. B. Dual FISH staining using DNA probes that label virtually all true bacteria (EUB338, red) and the γ-Proteobacter class to which C. rodentium belongs (GAM42a, green). Pathogenic bacteria (i.e. EUB338+/GAM42a+ cells) are yellow, and commensal bacteria (EUB338+/GAM42) cells are red. Note the non-ulcer associated bacterial microcolony containing commensal bacteria (red) mixed in with pathogenic bacteria (yellow) in Muc2−/− mice (left panels). Such mixed microcolonies were not seen in WT mice, which show predominantly pathogenic bacteria intimately adherent to the mucosa (right panel). Tissues were fixed in Carnoy's fixative prior to processing. Original magnification  = 200×. Scale bar  = 100 µm. C. SYBR green quantification of total bacterial burden per gram of colorectal lumen contents of WT vs. Muc2−/− mice before infection and at 6 DPI. Results are presented as the means of a total of 5–7 mice per group pooled from 2 independent experiments. Error bars  =  SEM (**P = 0.0082, Mann-Whitney test). D. Graph illustrating the percent composition of γ-Proteobacter (EUB338+/GAM42a+ cells), which is primarily represented by C. rodentium, in colorectal luminal content from uninfected or infected WT vs. Muc2−/− mice. Results are the mean percentages from a total of 5–7 mice per group pooled from 2 independent experiments. ND, none detected. Error bars  =  SEM. E. FISH staining as described above, showing a thick biofilm of mostly pathogenic but also commensal bacteria on the mucosal surface in a colonic section from a moribund Muc2−/− mouse at 10 DPI (inset). Such phenotypes were not observed in WT mice. Original magnification  = 200×. Scale bar  = 50 µm.
Figure 9
Figure 9. Susceptibility of Muc2−/− mice to C. rodentium is associated with severe defects in intestinal barrier function and increased translocation of commensal and pathogenic bacteria.
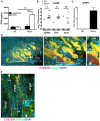
Muc2−/− mice display increased FITC-dextran flux across the intestinal mucosa during C. rodentium infection. Uninfected or C. rodentium infected (5 DPI) WT and Muc2−/− mice were gavaged with FITC-dextran (4 kDa) and serum was taken by cardiac puncture 4 hrs later, as described in Materials and Methods. A. Quantity of FD4 in serum from WT and Muc2−/− mice. Bars represent the average value of a total of 5–7 mice per group pooled from 2 individual experiments. Error bars  =  SEM (**P = 0.0051; ***P = 0.0006, Mann-Whitney test). B. Quantification of viable C. rodentium found in the spleens, liver, and MLNs of WT and Muc2−/− mice at 7 DPI. Each data point represents one animal. Bars represent the means of 9 WT and 12 Muc2−/− mice pooled from 3 independent experiments. Error bars  =  SEM (**P = 0.0031, Mann-Whitney test). C. Enumeration of live bacterial burdens cultured from the serum of Muc2−/− and WT mice at 6 DPI. Results represent the average of 8 WT and 12 Muc2−/− mice pooled from 3 independent experiments. Error bars  =  SEM. D. FISH staining showing invasive microcolonies within an ulcerated region in the descending colon of an infected Muc2−/− mouse. Pathogenic bacteria can be seen engulfed by PMNs that are attacking the microcolony (inset “a”, arrowheads). A commensal bacterial microcolony (red) can also be seen amongst the C. rodentium microcolonies and in contact with PMNs (inset “b”, arrow). Original magnification  = 200×. Scale bar  = 100 µm. E. Numerous γ-Proteobacter (C. rodentium, yellow; yellow arrowhead in inset) and non-γ-Proteobacter (red; white arrowhead in inset) can be seen invading the lamina propria of infected Muc2−/− mice (6 DPI). Lu =  gut lumen. LP =  lamina propria; Original Magnification, 200×. Results are representative of 3 separate experiments.
Figure 10
Figure 10. Antibiotic induced commensal depletion enhances pathogen colonization but does not alter host pathology in Muc2−/− mice.
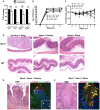
A. Quantification of DAPI stained bacteria from stools of WT and Muc2−/− mice 24 hours following oral treatment with Streptomycin (20 mg) or Vehicle (dH20). Streptomycin (strep) led to significantly reduced numbers of total bacteria within mouse stool. Results represent the means of 3–4 mice per group. Error bars  =  SEM (***P<0.001, unpaired t test). B. Enumeration of ΔespF C. rodentiumStr (strep-resistant) in stool of strep-or vehicle-treated mice as indicated, at various times post-infection. Results represent the means of 3–4 mice per group. Error bars  =  SEM (*P≤0.05, Mann-Whitney test, one-tailed). C. Body weights following infection of strep or vehicle treated WT and Muc2−/− mice with ΔespF C. rodentiumStr. n = 3–4 mice per group. Error bars  =  SEM. D. Representative histological sections of ceca from uninfected or infected (6 DPI) strep- or vehicle-treated WT and Muc2−/− mice. Original magnification  = 100×. Scale bar  = 100 µm. E. H&E (Left panel) and FISH analysis (right panel) of an ulcer from ΔespF C. rodentiumStr infected vehicle-treated Muc2−/− mouse cecum (6 DPI). Numerous commensals (EUB338+/GAM42 cells, red) can be seen overlying the ulcer in direct contact with PMNs (arrow), and both pathogen (EUB338+/GAM42a+ cells, yellow) and commensal (red) can be seen within the PMNs (arrow heads, inset). Original magnification  = 200×. Scale bars  = 100 µm. F. H&E and FISH analysis of an ulcer in the descending colon from an ΔespF C. rodentiumStr infected strep-treated Muc2 −/− mouse (6 DPI). Large pathogenic microcolonies (yellow) are associated with the ulcer (arrows), while commensals (red) can be seen in the lumen. Original magnification  = 200×. Scale bar  = 100 µm.
Figure 11
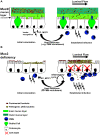
Figure 11. Proposed model of the role of Muc2 in the disassociation of A/E pathogen and commensal bacteria from the large intestinal mucosa.
A. In a Muc2-sufficient intestine, A/E bacteria such as C. rodentium (yellow) need to first traverse the outer and inner mucus layers to access the underlying epithelium. Following infection of epithelial cells, there is an enhancement in mucin secretion probably due to synergistic actions between bacterial products and host derived cytokines after innate recognition by pattern recognition receptors, and recruitment of inflammatory cells such as PMNs. In addition, there is moderate epithelial barrier dysfunction as a result of host and pathogen induced alteration of tight junctions. As the A/E pathogen replicates following intimate attachment, the secreted Muc2 binds newly reproduced bacteria and flushes them away from the surface to prevent microcolony formation on the surface and their translocation into the mucosa. B. In a state of Muc2-deficiency the lack of mucus causes a more rapid infection and an accumulation of pathogens that are loosely associated with the mucosa, forming microcolonies. Commensal bacteria (red) can also be caught up in these pathogenic microcolonies, further increasing total burden at the surface and likelihood of direct and/or indirect epithelial damage. Following infection, severe barrier dysfunction occurs, mostly by altered tight junctions as well as overt epithelial cell death. As a result both the loosely-adherent pathogens and commensals leak across the epithelia and into the mucosa, overwhelming the phagocytes and perpetuating a vicious inflammatory cycle.

Comment in

  • Stuck to MUC2.
    van Ooij C. van Ooij C. Nat Rev Microbiol. 2010 Jul;8(7):463. doi: 10.1038/nrmicro2390. Nat Rev Microbiol. 2010. PMID: 21394951 No abstract available.

Similar articles

Cited by

References

    1. Nataro JP, Kaper JB. Diarrheagenic Escherichia coli. Clin Microbiol Rev. 1998;11:142–201. - PMC - PubMed
    1. Fagundes-Neto U, Andrade JABd. Acute Diarrhea and Malnutrition: Lethality Risk in Hospitalized Infants. J Am Coll Nutr. 1999;18:303–308. - PubMed
    1. Vilchez S, Reyes D, Paniagua M, Bucardo F, Mollby R, et al. Prevalence of diarrhoeagenic Escherichia coli in children from Leon, Nicaragua. J Med Microbiol. 2009;58:630–637. - PubMed
    1. Gonzalez Garcia EA. Animal health and foodborne pathogens: enterohaemorrhagic O157:H7 strains and other pathogenic Escherichia coli virotypes (EPEC, ETEC, EIEC, EHEC). Pol J Vet Sci. 2002;5:103–115. - PubMed
    1. Karch H, Tarr PI, Bielaszewska M. Enterohaemorrhagic Escherichia coli in human medicine. International Journal of Medical Microbiology. 2005;295:405–418. - PubMed

Publication types

MeSH terms

LinkOut - more resources