

Interferon-alpha regulates the dynamic balance between human activated regulatory and effector T cells: implications for antiviral and autoimmune responses
- PMID: 20465564
- PMCID: PMC2966763
- DOI: 10.1111/j.1365-2567.2010.03280.x
Interferon-alpha regulates the dynamic balance between human activated regulatory and effector T cells: implications for antiviral and autoimmune responses
Erratum in
- Immunology. 2011 May;133(1):141
Abstract
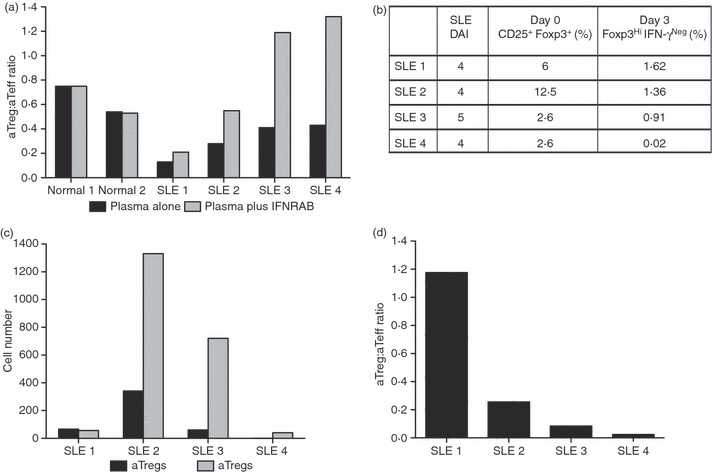
An adequate effector response against pathogens and its subsequent inactivation after pathogen clearance are critical for the maintenance of immune homeostasis. This process involves an initial phase of T-cell effector (Teff) activation followed by the expansion of regulatory T cells (Tregs), a unique cell population that limits Teff functions. However, significant questions remain unanswered about the mechanisms that regulate the balance between these cell populations. Using an in vitro system to mimic T-cell activation in human peripheral blood mononuclear cells (PBMC), we analysed the patterns of Treg and Teff activation, with special attention to the role of type I interferon (IFN-I). Interestingly, we found that IFN-alpha, either exogenously added or endogenously induced, suppressed the generation of CD4(+) FoxP3(HI )IFN-gamma(Neg) activated Tregs (aTregs) while simultaneously promoting propagation of CD4(+) FoxP3(Low/Neg )IFN-gamma(Pos) activated Teffs (aTeffs). We also showed that IFN-alpha-mediated inhibition of interleukin (IL)-2 production may play an essential role in IFN-alpha-induced suppression of aTregs. In order to test our findings in a disease state with chronically elevated IFN-alpha, we investigated systemic lupus erythematosus (SLE). Plasma from patients with SLE was found to contain IFN-I activity that suppressed aTreg generation. Furthermore, anti-CD3 activated SLE PBMCs exhibited preferential expansion of aTeffs with a very limited increase in aTreg numbers. Together, these observations support a model whereby a transient production of IFN-alpha (such as is seen in an early antiviral response) may promote CD4 effector functions by delaying aTreg generation, but a chronic elevation of IFN-alpha may tip the aTeff:aTreg balance towards aTeffs and autoimmunity.
Figures


Similar articles
-
Tremelimumab (anti-CTLA4) mediates immune responses mainly by direct activation of T effector cells rather than by affecting T regulatory cells.Clin Immunol. 2011 Jan;138(1):85-96. doi: 10.1016/j.clim.2010.09.011. Epub 2010 Nov 5. Clin Immunol. 2011. PMID: 21056008
-
Increased Levels of STAT1 Protein in Blood CD4 T Cells from Systemic Lupus Erythematosus Patients Are Associated with Perturbed Homeostasis of Activated CD45RA-FOXP3hi Regulatory Subset and Follow-Up Disease Severity.J Interferon Cytokine Res. 2017 Jun;37(6):254-268. doi: 10.1089/jir.2016.0040. Epub 2017 Mar 3. J Interferon Cytokine Res. 2017. PMID: 28256939
-
CD4+CD69+ T cells and CD4+CD25+FoxP3+ Treg cells imbalance in peripheral blood, spleen and peritoneal lavage from pristane-induced systemic lupus erythematosus (SLE) mice.Adv Rheumatol. 2019 Jul 24;59(1):30. doi: 10.1186/s42358-019-0072-x. Adv Rheumatol. 2019. PMID: 31340848
-
Identity of mysterious CD4+CD25-Foxp3+ cells in SLE.Arthritis Res Ther. 2010;12(1):101. doi: 10.1186/ar2894. Epub 2010 Jan 20. Arthritis Res Ther. 2010. PMID: 20122288 Free PMC article. Review.
-
Tregs are regulated by cytokines: implications for autoimmunity.Autoimmun Rev. 2008 Oct;8(1):83-7. doi: 10.1016/j.autrev.2008.08.002. Epub 2008 Sep 2. Autoimmun Rev. 2008. PMID: 18771756 Free PMC article. Review.
Cited by
-
Flow cytometry and targeted immune transcriptomics identify distinct profiles in patients with chronic myeloid leukemia receiving tyrosine kinase inhibitors with or without interferon-α.J Transl Med. 2020 Jan 3;18(1):2. doi: 10.1186/s12967-019-02194-x. J Transl Med. 2020. PMID: 31900171 Free PMC article.
-
Interferon γ and α Have Differential Effects on SAMHD1, a Potent Antiviral Protein, in Feline Lymphocytes.Viruses. 2019 Oct 9;11(10):921. doi: 10.3390/v11100921. Viruses. 2019. PMID: 31600877 Free PMC article.
-
Neuropilin 1: function and therapeutic potential in cancer.Cancer Immunol Immunother. 2014 Feb;63(2):81-99. doi: 10.1007/s00262-013-1500-0. Epub 2013 Nov 22. Cancer Immunol Immunother. 2014. PMID: 24263240 Free PMC article. Review.
-
Age-Related Differences in Percentages of Regulatory and Effector T Lymphocytes and Their Subsets in Healthy Individuals and Characteristic STAT1/STAT5 Signalling Response in Helper T Lymphocytes.J Immunol Res. 2015;2015:352934. doi: 10.1155/2015/352934. Epub 2015 Oct 7. J Immunol Res. 2015. PMID: 26525134 Free PMC article.
-
Type I interferons directly inhibit regulatory T cells to allow optimal antiviral T cell responses during acute LCMV infection.J Exp Med. 2014 May 5;211(5):961-74. doi: 10.1084/jem.20131556. Epub 2014 Apr 7. J Exp Med. 2014. PMID: 24711580 Free PMC article.
References
-
- Sakaguchi S, Ono M, Setoguchi R, et al. Foxp3+ CD25+ CD4+ natural regulatory T cells in dominant self-tolerance and autoimmune disease. Immunol Rev. 2006;212:8–27. - PubMed
-
- Hori S, Nomura T, Sakaguchi S. Control of regulatory T cell development by the transcription factor Foxp3. Science. 2003;299:1057–61. - PubMed
-
- Ziegler SF. FOXP3: not just for regulatory T cells anymore. Eur J Immunol. 2007;37:21–3. - PubMed
Publication types
MeSH terms
Substances
Grants and funding
LinkOut - more resources
Full Text Sources
Research Materials
