

Host-detrimental role of Esx-1-mediated inflammasome activation in mycobacterial infection
- PMID: 20463815
- PMCID: PMC2865529
- DOI: 10.1371/journal.ppat.1000895
Host-detrimental role of Esx-1-mediated inflammasome activation in mycobacterial infection
Abstract
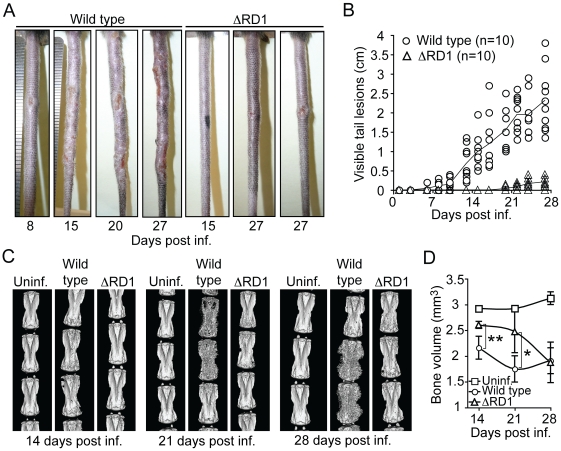
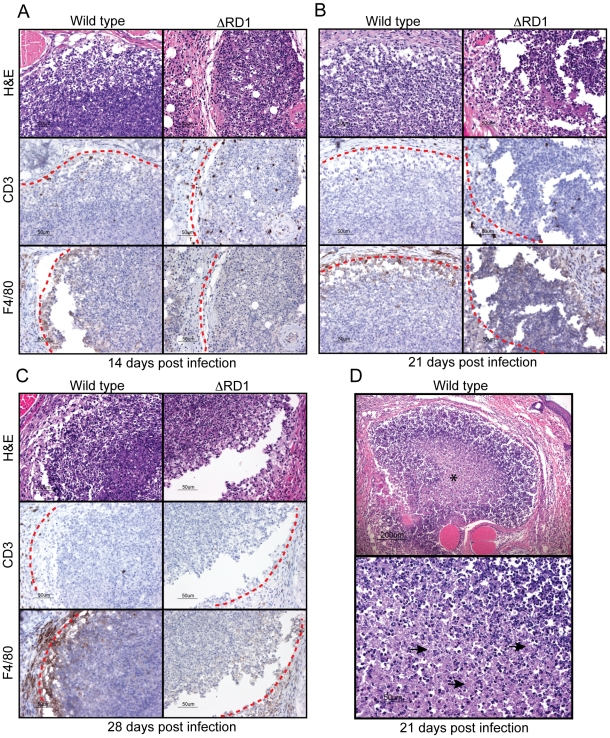
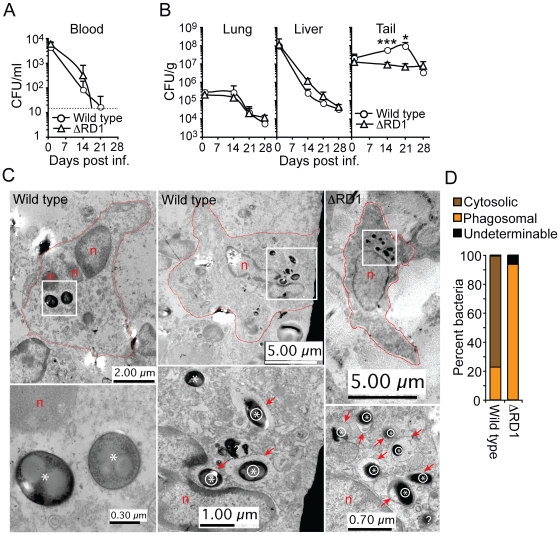
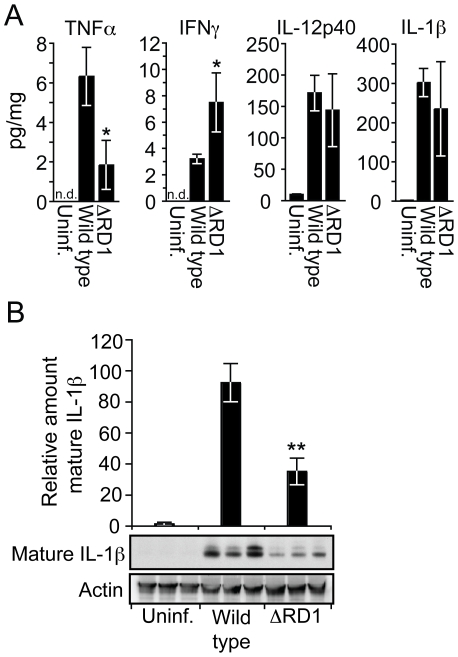
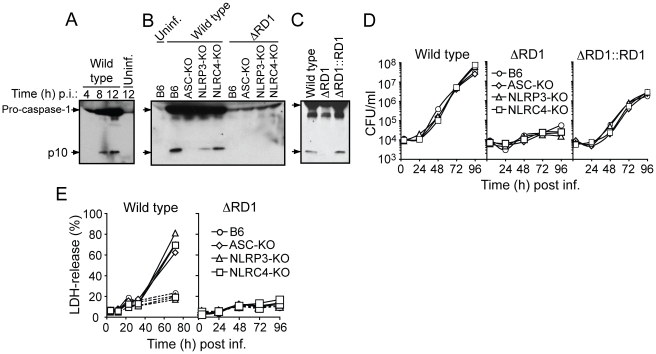
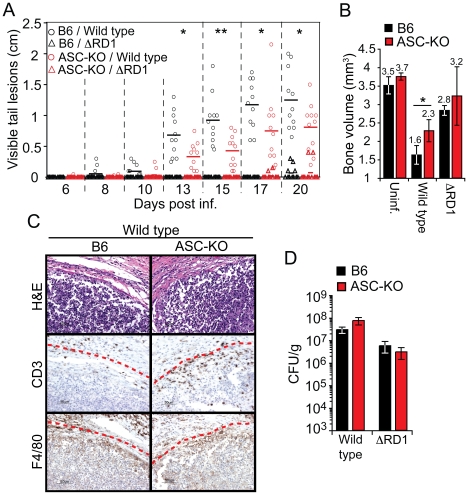
The Esx-1 (type VII) secretion system is a major virulence determinant of pathogenic mycobacteria, including Mycobacterium marinum. However, the molecular events and host-pathogen interactions underlying Esx-1-mediated virulence in vivo remain unclear. Here we address this problem in a non-lethal mouse model of M. marinum infection that allows detailed quantitative analysis of disease progression. M. marinum established local infection in mouse tails, with Esx-1-dependent formation of caseating granulomas similar to those formed in human tuberculosis, and bone deterioration reminiscent of skeletal tuberculosis. Analysis of tails infected with wild type or Esx-1-deficient bacteria showed that Esx-1 enhanced generation of proinflammatory cytokines, including the secreted form of IL-1beta, suggesting that Esx-1 promotes inflammasome activation in vivo. In vitro experiments indicated that Esx-1-dependent inflammasome activation required the host NLRP3 and ASC proteins. Infection of wild type and ASC-deficient mice demonstrated that Esx-1-dependent inflammasome activation exacerbated disease without restricting bacterial growth, indicating a host-detrimental role of this inflammatory pathway in mycobacterial infection. These findings define an immunoregulatory role for Esx-1 in a specific host-pathogen interaction in vivo, and indicate that the Esx-1 secretion system promotes disease and inflammation through its ability to activate the inflammasome.
Conflict of interest statement
All authors are full time employees of Genentech.
Figures
Similar articles
-
ESX-1-dependent cytolysis in lysosome secretion and inflammasome activation during mycobacterial infection.Cell Microbiol. 2008 Sep;10(9):1866-78. doi: 10.1111/j.1462-5822.2008.01177.x. Epub 2008 Jun 28. Cell Microbiol. 2008. PMID: 18503637 Free PMC article.
-
The ESX-5 secretion system of Mycobacterium marinum modulates the macrophage response.J Immunol. 2008 Nov 15;181(10):7166-75. doi: 10.4049/jimmunol.181.10.7166. J Immunol. 2008. PMID: 18981138
-
A New ESX-1 Substrate in Mycobacterium marinum That Is Required for Hemolysis but Not Host Cell Lysis.J Bacteriol. 2019 Jun 21;201(14):e00760-18. doi: 10.1128/JB.00760-18. Print 2019 Jul 15. J Bacteriol. 2019. PMID: 30833360 Free PMC article.
-
Modeling Tubercular ESX-1 Secretion Using Mycobacterium marinum.Microbiol Mol Biol Rev. 2020 Sep 2;84(4):e00082-19. doi: 10.1128/MMBR.00082-19. Print 2020 Nov 18. Microbiol Mol Biol Rev. 2020. PMID: 32878966 Free PMC article. Review.
-
Looking within the zebrafish to understand the tuberculous granuloma.Adv Exp Med Biol. 2013;783:251-66. doi: 10.1007/978-1-4614-6111-1_13. Adv Exp Med Biol. 2013. PMID: 23468113 Review.
Cited by
-
Automated quantitative assay of fibrosis characteristics in tuberculosis granulomas.Front Microbiol. 2024 Jan 3;14:1301141. doi: 10.3389/fmicb.2023.1301141. eCollection 2023. Front Microbiol. 2024. PMID: 38235425 Free PMC article.
-
Inflammasome in the Pathogenesis of Pulmonary Diseases.Exp Suppl. 2018;108:111-151. doi: 10.1007/978-3-319-89390-7_6. Exp Suppl. 2018. PMID: 30536170 Free PMC article.
-
Mycobacterium tuberculosis synergizes with ATP to induce release of microvesicles and exosomes containing major histocompatibility complex class II molecules capable of antigen presentation.Infect Immun. 2010 Dec;78(12):5116-25. doi: 10.1128/IAI.01089-09. Epub 2010 Sep 13. Infect Immun. 2010. PMID: 20837713 Free PMC article.
-
Serum IL-1β and IL-18 correlate with ESR and CRP in multidrug-resistant tuberculosis patients.J Biomed Res. 2015 Sep;29(5):426-8. doi: 10.7555/JBR.29.20150077. Epub 2015 Jul 20. J Biomed Res. 2015. PMID: 26445573 Free PMC article. No abstract available.
-
Checks and Balances between Autophagy and Inflammasomes during Infection.J Mol Biol. 2018 Jan 19;430(2):174-192. doi: 10.1016/j.jmb.2017.11.006. Epub 2017 Nov 21. J Mol Biol. 2018. PMID: 29162504 Free PMC article. Review.
References
-
- Cosma CL, Sherman DR, Ramakrishnan L. The secret lives of the pathogenic mycobacteria. Annu Rev Microbiol. 2003;57:641–676. - PubMed
-
- Travis WD, Travis LB, Roberts GD, Su DW, Weiland LW. The histopathologic spectrum in Mycobacterium marinum infection. Arch Pathol Lab Med. 1985;109:1109–1113. - PubMed
Publication types
MeSH terms
Substances
LinkOut - more resources
Full Text Sources
Miscellaneous
