. 2010 May 13:11:247.
doi: 10.1186/1471-2105-11-247.

Genome-wide estimation of firing efficiencies of origins of DNA replication from time-course copy number variation data

Affiliations

Genome-wide estimation of firing efficiencies of origins of DNA replication from time-course copy number variation data

Huaien Luo et al. BMC Bioinformatics. .

Abstract

Background: DNA replication is a fundamental biological process during S phase of cell division. It is initiated from several hundreds of origins along whole chromosome with different firing efficiencies (or frequency of usage). Direct measurement of origin firing efficiency by techniques such as DNA combing are time-consuming and lack the ability to measure all origins. Recent genome-wide study of DNA replication approximated origin firing efficiency by indirectly measuring other quantities related to replication. However, these approximation methods do not reflect properties of origin firing and may lead to inappropriate estimations.

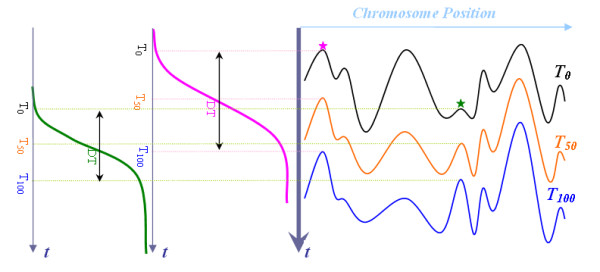
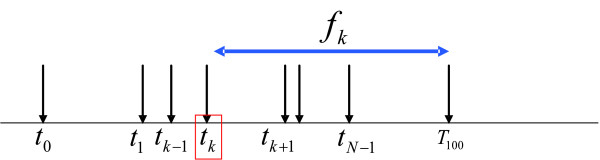
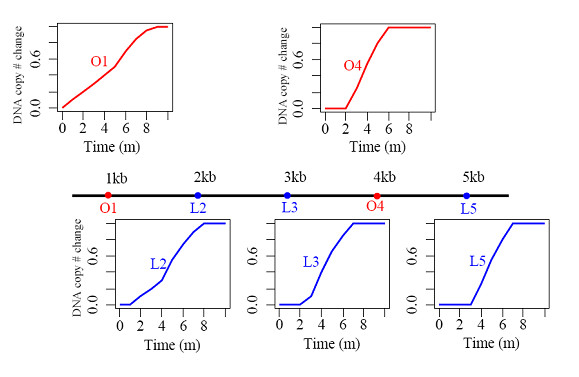
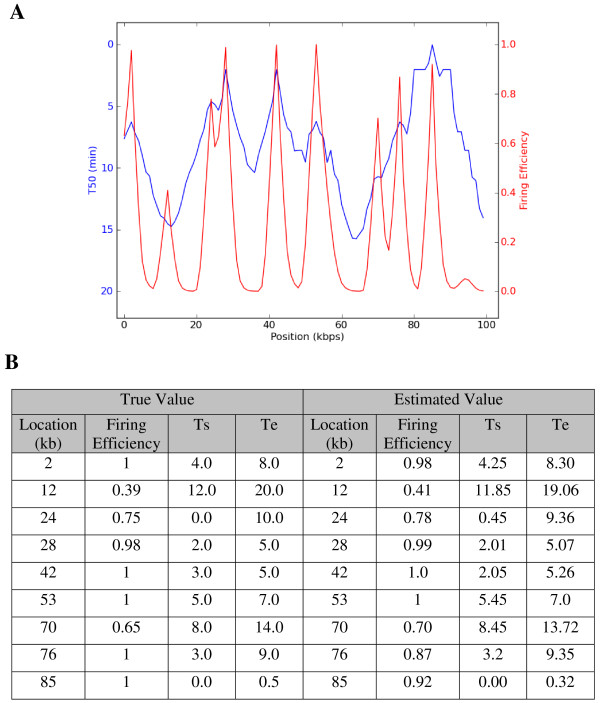
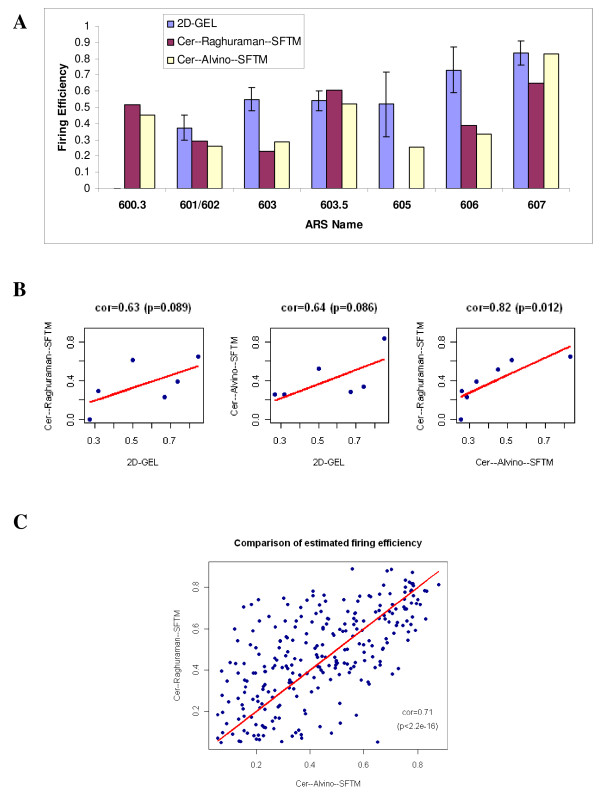
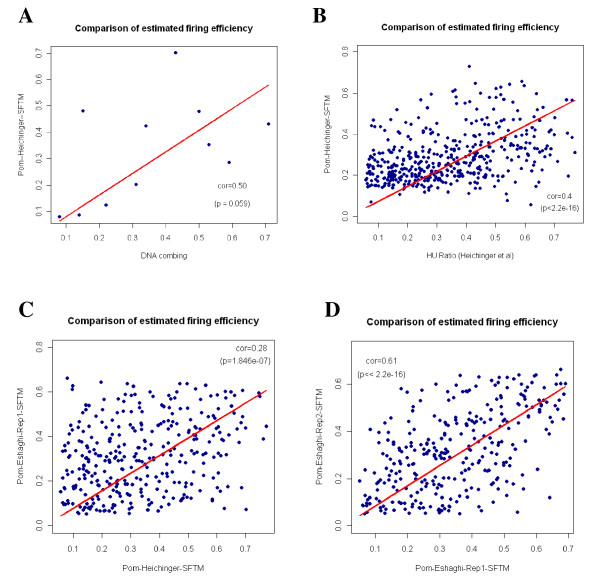
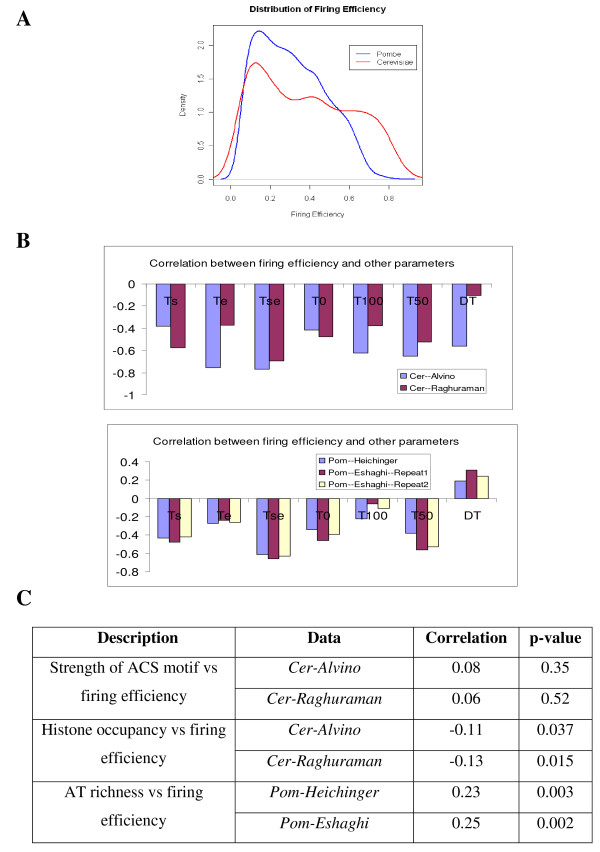
Results: In this paper, we develop a probabilistic model - Spanned Firing Time Model (SFTM) to characterize DNA replication process. The proposed model reflects current understandings about DNA replication. Origins in an individual cell may initiate replication randomly within a time window, but the population average exhibits a temporal program with some origins replicated early and the others late. By estimating DNA origin firing time and fork moving velocity from genome-wide time-course S-phase copy number variation data, we could estimate firing efficiency of all origins. The estimated firing efficiency is correlated well with the previous studies in fission and budding yeasts.

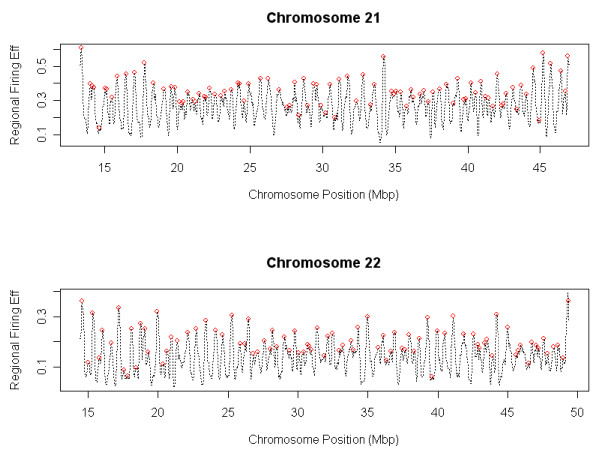
Conclusions: The new probabilistic model enables sensitive identification of origins as well as genome-wide estimation of origin firing efficiency. We have successfully estimated firing efficiencies of all origins in S. cerevisiae, S. pombe and human chromosomes 21 and 22.


Figures

Figure 1
Figure 1
Illustration of DNA replication profile. Left: DNA content change at an early origin (magenta) and a late origin (green). DNA starts to replicate in a population of cells at time T0 and gradually increases until it doubles in all cells at time T100 . The average replication time T50 approximates the time at which half cells had the origin replicated. The replication span DT reflects how fast a given locus can be replicated. Different origins may start to replicate or complete replication at different times with different average replication times or different replication spans. Right: Replication profiles T0 , T50 and T100 along the genome. The local maxima (peaks) define the location of origins (an early and a late origin are marked with star), while the local minima (valleys) represents the locations where the replication forks from two flanking origins converge.
Figure 2
Figure 2
Illustration of the firing time and its relevance to firing efficiency. Replication forks/windows from N origins can arrive before replication completion time T100 of origin k. Origin k starts to fire at time tk . The firing efficiency is then determined from the relative amount of active replication by origin k and passive replications by other origins.
Figure 3
Figure 3
Illustration of DNA replication process based on Spanned Firing Time Model. Suppose two origins (red) at locations 1 kbps and 4 kbps fire within the timing window (0,10) and (2,6) (minutes) respectively. The replication fork travels at a velocity of 1 kbps/min. The graphs in the figure are the simulated DNA replication pattern averaged over the cell culture at several positions along the simulated chromosome.
Figure 4
Figure 4
A simulation study of the proposed model. (A) Traditional methods estimate the locations of origins from the peaks of T50 timing profile (shown in blue); while the proposed method estimates locations of origins from the regional firing efficiency curve (shown in red). (B) A comparison between the true value and estimated value of locations of origins, firing efficiency, firing staring time (Ts ) and ending time (Te ).
Figure 5
Figure 5
Comparison of estimated firing efficiencies of origins in S.cerevisiae. (A) Estimated firing efficiencies of origins on Chromosome VI of S.cerevisiae. The height of the vertical bar shows our estimation by applying the proposed SFTM to two microarray timecourse data sets (Cer-Raghuraman and Cer-Alvino) and Friedman's estimation by using 2-D gel electrophoresis [7]. The error bar of 2-D gel estimation reflects the variation in firing efficiencies among different strains. (B) Pairwise scatter plots of origin firing efficiencies estimated from three sources in (A). The correlation coefficients are shown at the top of the respective figures. The good consistency between these results suggests that SFTM is a valid method to estimate firing efficiency. (C) Scatter plot of the estimated firing efficiencies of the matched origins from two S.cerevisiae data sets Cer-Raghuraman and Cer-Alvino by applying SFTM.
Figure 6
Figure 6
Comparison of estimated firing efficiencies of origins in S.pombe. (A) Comparison of estimated S.pombe origin efficiencies from single DNA molecular technique (Patel et al, 2006) and the proposed SFTM model applied to the Pom-Heichinger microarray data. The efficiencies of 11 origins estimated by both methods are plotted against each other. (B) Comparison of estimated origin efficiencies by measuring the signal ratio in the HU experiment (Heichinger et al, 2006) and the proposed SFTM model applied to the Pom-Heichinger time-course microarray data. (C) Comparison of estimated origin efficiencies by applying the proposed SFTM model to two microarray datasets: Pom-Heichinger and Pom-Eshaghi. (D) Comparison of estimated origin efficiencies by applying the proposed SFTM model to the two repeats of DNA replication dataset Pom-Eshaghi. The red line in these figures shows a linear fitting (without intercept) of the two estimations illustrated in each figure. The good consistency between these results indicates that SFTM is a reliable and valid method to estimate firing efficiency at genomic scale.
Figure 7
Figure 7
Characterizing the temporal parameters of origins firing/replication. (A) Distributions of origin firing efficiency in S.cerevisiae and S.pombe. (B) Correlation between firing efficiency and other parameters: Ts (firing starting time), Te (firing ending time), Tse (average firing time), T0 (replication initiation time), T100 (replication completion time), T50 (average replication time) and DT (replication span). (up) Correlation obtained from two DNA replication microarray data sets of S.cerevisiae: Cer-Raghuraman and Cer-Alvino; (bottom) Correlation obtained from microarray data sets of S.pombe: Pom-Heichinger and Pom-Eshaghi-Repeat1/2. (C) Correlation between origin firing efficiency and the factors that may regulate efficiency: strength of ACS motif, Histone occupancy level and AT richness around origins.
Figure 8
Figure 8
Estimated locations and firing efficiencies of origins on chromosome 21 and 22 of human. Dashed line represents the estimated regional firing efficiency curve. Origins are located at the peaks where the height represents the firing efficiency of each origin (red circles).

Similar articles

Cited by

  • DNA replication timing.
    Rhind N, Gilbert DM. Rhind N, et al. Cold Spring Harb Perspect Biol. 2013 Aug 1;5(8):a010132. doi: 10.1101/cshperspect.a010132. Cold Spring Harb Perspect Biol. 2013. PMID: 23838440 Free PMC article. Review.
  • Mathematical modeling of genome replication.
    Retkute R, Nieduszynski CA, de Moura A. Retkute R, et al. Phys Rev E Stat Nonlin Soft Matter Phys. 2012 Sep;86(3 Pt 1):031916. doi: 10.1103/PhysRevE.86.031916. Epub 2012 Sep 17. Phys Rev E Stat Nonlin Soft Matter Phys. 2012. PMID: 23030953 Free PMC article.
  • Dynamics of DNA replication in yeast.
    Retkute R, Nieduszynski CA, de Moura A. Retkute R, et al. Phys Rev Lett. 2011 Aug 5;107(6):068103. doi: 10.1103/PhysRevLett.107.068103. Epub 2011 Aug 4. Phys Rev Lett. 2011. PMID: 21902372 Free PMC article.
  • The spatiotemporal program of replication in the genome of Lachancea kluyveri.
    Agier N, Romano OM, Touzain F, Cosentino Lagomarsino M, Fischer G. Agier N, et al. Genome Biol Evol. 2013;5(2):370-88. doi: 10.1093/gbe/evt014. Genome Biol Evol. 2013. PMID: 23355306 Free PMC article.
  • Replication timing and its emergence from stochastic processes.
    Bechhoefer J, Rhind N. Bechhoefer J, et al. Trends Genet. 2012 Aug;28(8):374-81. doi: 10.1016/j.tig.2012.03.011. Epub 2012 Apr 18. Trends Genet. 2012. PMID: 22520729 Free PMC article. Review.

References

    1. Bell SP. The origin recognition complex: from simple origins to complex functions. Genes Dev. 2002;16:659–672. doi: 10.1101/gad.969602. - DOI - PubMed
    1. Theis JF, Newlon CS. The ARS309 chromosomal replicator of Saccharomyces cerevisiae depends on an exceptional ARS consensus sequence. Proc Natl Acad Sci USA. 1997;94:10786–10791. doi: 10.1073/pnas.94.20.10786. - DOI - PMC - PubMed
    1. Segurado M, de Luis A, Antequera F. Genome-wide distribution of DNA replication origins at A+T-rich islands in Schizosaccharomyces pombe. EMBO Rep. 2003;4:1048–1053. doi: 10.1038/sj.embor.7400008. - DOI - PMC - PubMed
    1. Lygeros J, Koutroumpas K, Dimopoulos S, Legouras I, Kouretas P, Heichinger C, Nurse P, Lygerou Z. Stochastic hybrid modeling of DNA replication across a complete genome. Proc Natl Acad Sci. 2008;105:12295–12300. doi: 10.1073/pnas.0805549105. - DOI - PMC - PubMed
    1. Blow J, Ge X. A model for DNA replication showing how dormant origins safeguard against replication fork failure. EMBO reports. 2009;10:405–412. doi: 10.1038/embor.2009.5. - DOI - PMC - PubMed

Publication types

LinkOut - more resources