Role of the C-terminal domain of the HIV-1 glycoprotein in cell-to-cell viral transmission between T lymphocytes
- PMID: 20459872
- PMCID: PMC2875203
- DOI: 10.1186/1742-4690-7-43
Role of the C-terminal domain of the HIV-1 glycoprotein in cell-to-cell viral transmission between T lymphocytes
Abstract
Background: Mutant HIV (HIV-Env-Tr712) lacking the cytoplasmic tail of the viral glycoprotein (Env-CT) exhibits a cell-type specific replication phenotype such that replicative spread occurs in some T-cell lines (referred to as permissive cells) but fails to do so in most T-cell lines or in PBMCs (referred to as non-permissive cells). We aim to gain insight on the underlying requirement for the Env-CT for viral spread in non-permissive cells.
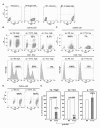
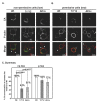
Results: We established that in comparison to HIV-Wt, both cell-free and cell-to-cell transmission of mutant HIV-Env-Tr712 from non-permissive cells were severely impaired under naturally low infection conditions. This requirement for Env-CT could be largely overcome by using saturating amounts of virus for infection. We further observed that in permissive cells, which supported both routes of mutant virus transmission, viral gene expression levels, Gag processing and particle release were inherently higher than in non-permissive cells, a factor which may be significantly contributing to their permissivity phenotype. Additionally, and correlating with viral transfer efficiencies in these cell types, HIV-Gag accumulation at the virological synapse (VS) was reduced to background levels in the absence of the Env-CT in conjugates of non-permissive cells but not in permissive cells.
Conclusions: During natural infection conditions, the HIV-Env-CT is critically required for viral transmission in cultures of non-permissive cells by both cell-free and cell-to-cell routes and is instrumental for Gag accumulation to the VS. The requirement of the Env-CT for these related processes is abrogated in permissive cells, which exhibit higher HIV gene expression levels.
Figures


Similar articles
-
Elucidating the Basis for Permissivity of the MT-4 T-Cell Line to Replication of an HIV-1 Mutant Lacking the gp41 Cytoplasmic Tail.J Virol. 2020 Nov 9;94(23):e01334-20. doi: 10.1128/JVI.01334-20. Print 2020 Nov 9. J Virol. 2020. PMID: 32938764 Free PMC article.
-
Cell-free infectivity of HIV type 1 produced in nonpermissive cells is only moderately impacted by C-terminal Env truncation despite abrogation of viral spread.AIDS Res Hum Retroviruses. 2007 May;23(5):729-40. doi: 10.1089/aid.2006.0260. AIDS Res Hum Retroviruses. 2007. PMID: 17531000
-
HIV-1 Matrix Trimerization-Impaired Mutants Are Rescued by Matrix Substitutions That Enhance Envelope Glycoprotein Incorporation.J Virol. 2019 Dec 12;94(1):e01526-19. doi: 10.1128/JVI.01526-19. Print 2019 Dec 12. J Virol. 2019. PMID: 31619553 Free PMC article.
-
Generation of H9 T-cells stably expressing a membrane-bound form of the cytoplasmic tail of the Env-glycoprotein: lack of transcomplementation of defective HIV-1 virions encoding C-terminally truncated Env.Retrovirology. 2006 May 16;3:27. doi: 10.1186/1742-4690-3-27. Retrovirology. 2006. PMID: 16700925 Free PMC article.
-
HIV-1 replication.Somat Cell Mol Genet. 2001 Nov;26(1-6):13-33. doi: 10.1023/a:1021070512287. Somat Cell Mol Genet. 2001. PMID: 12465460 Review.
Cited by
-
Elucidating the Basis for Permissivity of the MT-4 T-Cell Line to Replication of an HIV-1 Mutant Lacking the gp41 Cytoplasmic Tail.J Virol. 2020 Nov 9;94(23):e01334-20. doi: 10.1128/JVI.01334-20. Print 2020 Nov 9. J Virol. 2020. PMID: 32938764 Free PMC article.
-
HIV-1 Gag, Envelope, and Extracellular Determinants Cooperate To Regulate the Stability and Turnover of Virological Synapses.J Virol. 2016 Jun 24;90(14):6583-6597. doi: 10.1128/JVI.00600-16. Print 2016 Jul 15. J Virol. 2016. PMID: 27170746 Free PMC article.
-
The frantic play of the concealed HIV envelope cytoplasmic tail.Retrovirology. 2013 May 24;10:54. doi: 10.1186/1742-4690-10-54. Retrovirology. 2013. PMID: 23705972 Free PMC article. Review.
-
Structural and functional comparisons of retroviral envelope protein C-terminal domains: still much to learn.Viruses. 2014 Jan 16;6(1):284-300. doi: 10.3390/v6010284. Viruses. 2014. PMID: 24441863 Free PMC article. Review.
-
Mutations in the cytoplasmic domain of the Newcastle disease virus fusion protein confer hyperfusogenic phenotypes modulating viral replication and pathogenicity.J Virol. 2013 Sep;87(18):10083-93. doi: 10.1128/JVI.01446-13. Epub 2013 Jul 10. J Virol. 2013. PMID: 23843643 Free PMC article.
References
Publication types
MeSH terms
Substances
LinkOut - more resources
Full Text Sources

