

BISMA--fast and accurate bisulfite sequencing data analysis of individual clones from unique and repetitive sequences
- PMID: 20459626
- PMCID: PMC2877691
- DOI: 10.1186/1471-2105-11-230
BISMA--fast and accurate bisulfite sequencing data analysis of individual clones from unique and repetitive sequences
Abstract
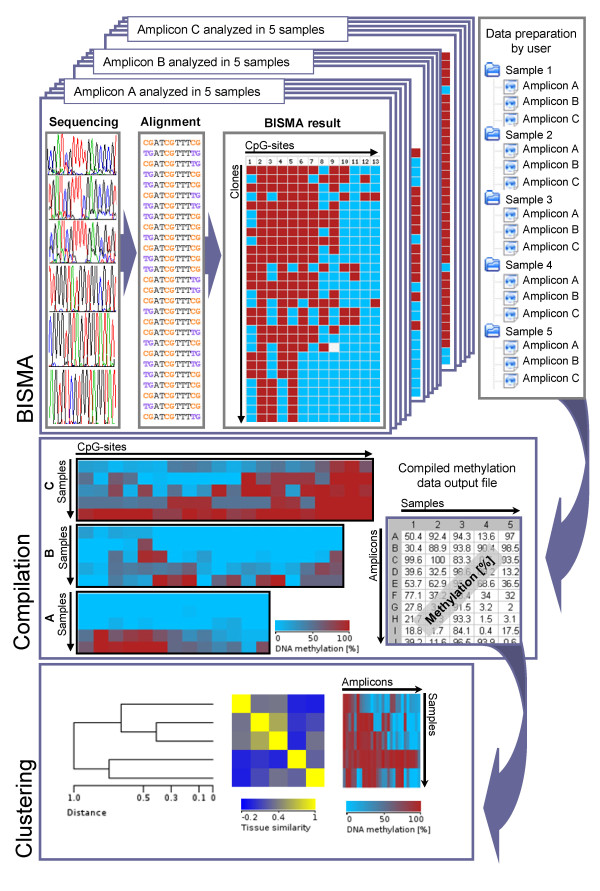
Background: Bisulfite sequencing is a popular method to analyze DNA methylation patterns at high resolution. A region of interest is targeted by PCR and about 20-50 subcloned DNA molecules are usually analyzed, to determine the methylation status at single CpG sites and molecule resolution.
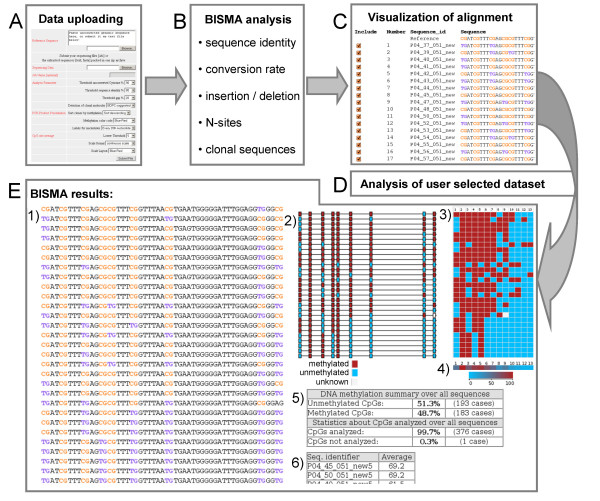
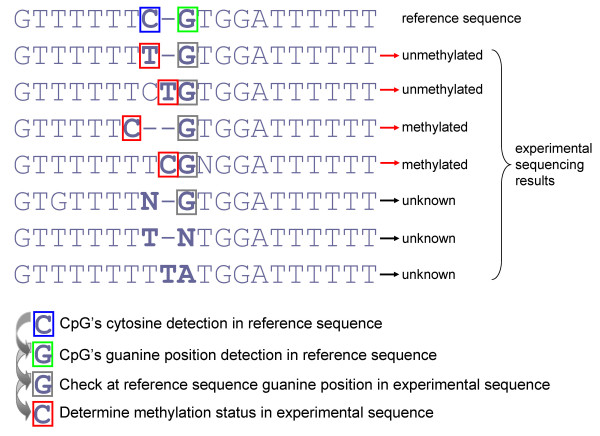
Results: The BISMA (Bisulfite Sequencing DNA Methylation Analysis) software for analysis of primary bisulfite sequencing data implements sequencing data extraction and enhanced data processing, quality controls, analysis and presentation of the methylation state. It uses an improved strategy for detection of clonal molecules and accurate CpG site detection and it supports for the first time analysis of repetitive sequences.
Conclusions: BISMA works highly automated but still provides the user full control over all steps of the analysis. The BISMA software is freely available as an online tool for academic purposes for the analysis of bisulfite sequencing data from both unique and repetitive sequences http://biochem.jacobs-university.de/BDPC/BISMA/.
Figures


Similar articles
-
BSPAT: a fast online tool for DNA methylation co-occurrence pattern analysis based on high-throughput bisulfite sequencing data.BMC Bioinformatics. 2015 Jul 11;16:220. doi: 10.1186/s12859-015-0649-2. BMC Bioinformatics. 2015. PMID: 26163275 Free PMC article.
-
Bisulfite sequencing Data Presentation and Compilation (BDPC) web server--a useful tool for DNA methylation analysis.Nucleic Acids Res. 2008 Mar;36(5):e34. doi: 10.1093/nar/gkn083. Epub 2008 Feb 22. Nucleic Acids Res. 2008. PMID: 18296484 Free PMC article.
-
BSMAP: whole genome bisulfite sequence MAPping program.BMC Bioinformatics. 2009 Jul 27;10:232. doi: 10.1186/1471-2105-10-232. BMC Bioinformatics. 2009. PMID: 19635165 Free PMC article.
-
Strategies for analyzing bisulfite sequencing data.J Biotechnol. 2017 Nov 10;261:105-115. doi: 10.1016/j.jbiotec.2017.08.007. Epub 2017 Aug 16. J Biotechnol. 2017. PMID: 28822795 Review.
-
Limitations and advantages of MS-HRM and bisulfite sequencing for single locus methylation studies.Expert Rev Mol Diagn. 2010 Jul;10(5):575-80. doi: 10.1586/erm.10.46. Expert Rev Mol Diagn. 2010. PMID: 20629507 Review.
Cited by
-
Increased In Vitro Osteopotential in SHED Associated with Higher IGF2 Expression When Compared with hASCs.Stem Cell Rev Rep. 2015 Aug;11(4):635-44. doi: 10.1007/s12015-015-9592-x. Stem Cell Rev Rep. 2015. PMID: 25931278
-
Gadd45a promotes DNA demethylation through TDG.Nucleic Acids Res. 2015 Apr 30;43(8):3986-97. doi: 10.1093/nar/gkv283. Epub 2015 Apr 6. Nucleic Acids Res. 2015. PMID: 25845601 Free PMC article.
-
A tissue-based comparative effectiveness analysis of biomarkers for early detection of colorectal tumors.Clin Transl Gastroenterol. 2012 Dec 6;3(12):e27. doi: 10.1038/ctg.2012.21. Clin Transl Gastroenterol. 2012. PMID: 23324654 Free PMC article.
-
Functional integration of a semi-synthetic azido-queuosine derivative into translation and a tRNA modification circuit.Nucleic Acids Res. 2022 Oct 14;50(18):10785-10800. doi: 10.1093/nar/gkac822. Nucleic Acids Res. 2022. PMID: 36169220 Free PMC article.
-
Activation of Estrogen Receptor Alpha by Decitabine Inhibits Osteosarcoma Growth and Metastasis.Cancer Res. 2019 Mar 15;79(6):1054-1068. doi: 10.1158/0008-5472.CAN-18-1255. Epub 2018 Dec 28. Cancer Res. 2019. PMID: 30593524 Free PMC article.
References
Publication types
MeSH terms
Substances
LinkOut - more resources
Full Text Sources
Other Literature Sources
