. 2010 May 28;32(5):654-69.
doi: 10.1016/j.immuni.2010.04.011. Epub 2010 May 6.

Human immunodeficiency virus-1 inhibition of immunoamphisomes in dendritic cells impairs early innate and adaptive immune responses

Affiliations

Human immunodeficiency virus-1 inhibition of immunoamphisomes in dendritic cells impairs early innate and adaptive immune responses

Fabien P Blanchet et al. Immunity. .

Abstract

Dendritic cells (DCs) in mucosal surfaces are early targets for human immunodeficiency virus-1 (HIV-1). DCs mount rapid and robust immune responses upon pathogen encounter. However, immune response in the early events of HIV-1 transmission appears limited, suggesting that HIV-1 evade early immune control by DCs. We report that HIV-1 induces a rapid shutdown of autophagy and immunoamphisomes in DCs. HIV-1 envelope activated the mammalian target of rapamycin pathway in DCs, leading to autophagy exhaustion. HIV-1-induced inhibition of autophagy in DC increased cell-associated HIV-1 and transfer of HIV-1 infection to CD4(+) T cells. HIV-1-mediated downregulation of autophagy in DCs impaired innate and adaptive immune responses. Immunoamphisomes in DCs engulf incoming pathogens and appear to amplify pathogen degradation as well as Toll-like receptor responses and antigen presentation. The findings that HIV-1 downregulates autophagy and impedes immune functions of DCs represent a pathogenesis mechanism that can be pharmacologically countered with therapeutic and prophylactic implications.


Figures

Figure 1
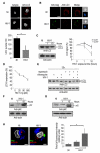
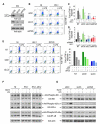
Figure 1. Loss of LC3-II in HIV-1-Infected DCs and MyDCs Is Due to a Block in the Initiation Step of Autophagic Flux
(A) Confocal immunofluorescence analysis of LC3 (red) in unexposed iDC (NI) or 20 hr HIV-1-exposed iDCs (HIV-1). DAPI (nucleus) is shown in gray. Quantification of absolute number of LC3+ puncta (lower graph). Data are means of 30 acquired fields (±SD) and representative of three experiments. Scale bars represent 5 μm. (B) Confocal immunofluorescence of HIVGag (green) and LC3 (red) in unexposed or HIV-1 pulsed MyDCs for 20 hr. Data are representative of two independent experiments. Scale bars represent 5 μm. (C) The left panel shows immunoblot analysis of LC3 in lysates of DC exposed to HIV-1 for indicated times. The right panel shows quantification of LC3-I and LC3-II levels normalized to actin. Actin expression at time 0 was considered 100%. Data are means (±SD) of four independent experiments. (D) Graph representing quantification of LC3-II normalized to actin in DCs (see representative experiment in Figure S1). Error bars represent the mean ± SD of three independent experiments. (E) Lysates of iDCs, preincubated or not for 2 hr with rapamycin (50 μg/ml) and/or 30 min with chloroquine (10 μM) when indicated and then left untreated or treated with HIV-1 for 12 hr were immunoblotted with anti-LC3 (upper panels). Arrows indicate migration of LC3-I and LC3-II forms. Equal sample loading was controlled with anti-actin (lower panels). Data are representative of three experiments. (F) Immunoblot analysis of p62 in lysates of DCs nonexposed (NI) or pulsed with HIV-1 for indicated times. Experiments were done in two donors. (G) Immunoblot analysis of p62 in lysates of MyDC nonexposed or pulsed with HIV-1 for indicated times. Experiments were done in two donors. (H) Confocal analysis of DC pulsed or not pulsed with HIV-1 for 20 hr. Cells were fixed, permeabilized, and stained with anti-HIV-1Gag (green), anti-poly-Ub (red), and anti-Lamp1 (blue). Quantification of poly-Ub fluorescence signal intensity was measured in unexposed DCs (NI) or DCs pulsed with increasing doses of HIV-1 (50–500 ng p24). Data are means of fluorescence intensity (±SD) in 30 cells and representative of two experiments. Scale bars represent 5 μm.
Figure 2
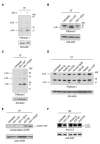
Figure 2. HIV-1 Envelope Induces mTOR Signaling Pathway Activation
(A) The upper panel shows an immunoblot of DC lysates with PathScan I cocktail recognizing phosphorylated mTOR pathway proteins after 15 min of HIV-1 exposure. Arrows indicate bands corresponding to Erk and S6 phosphorylated proteins. Experiment shown is representative of five independent experiments. (B) Lysates of DC untreated or treated with HIV-1 or with HIV-1-ΔEnv (500 ng p24 each) for 15 min and immunoblotted with PathScan I cocktail. Arrow indicates S6 phosphorylated protein. Data are representative of three independent experiments. (C) Immunoblot with PathScan I cocktail of lysates of DCs untreated or treated for 15 min with HIV-1 or HIV-1-F522Y. Arrows indicate bands corresponding to Akt, Erk, and S6 phosphorylated proteins. Loading was controlled with anti-actin (lower panel). Data are representative of two experiments. (D) PathScan I immunoblotting on lysates of 5 × 10⁵ DCs untreated or treated for 15 min with mouse Ig (10 μg/ml), rabbit Ig (10 μg/ml), mouse anti-CD4 (10 μg/ml), rabbit anti-DC-Sign (H-200 at 10 μg/ml), rgp120 (5 μg/ml), rantes (10 nM), and HIV-1 (1 μg p24). Phosphorylated Erk and S6 migrating bands are indicated by arrows. Similar results were obtained in three independent experiments. (E) Lysates of DCs untreated or treated with HIV-1, HIV-1-ΔEnv, or HIV-1-F522Y (500 ng p24 each) for 15 min and immunoblotted with anti-phospho2448-mTOR. Arrow indicates phosphorylated mTOR protein. Equivalent loading was controlled by immunoblotting with anti-mTOR (lower panel). Data are representative of three independent experiments. (F) Lysates of iDCs untreated or incubated for 12 hr with HIV-1 (1 μg p24), Ig isotype (10 μg/ml), rgp120 (5 μg/ml), and anti-CD4 (10 μg/ml) were immunoblotted with anti-LC3 (upper panels). Loading was controlled with anti-actin (lower panels). Data are representative of two experiments.
Figure 3
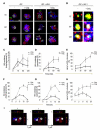
Figure 3. HIV-1 Traffics via Autophagosomes Prior to Lysosomal Targeting
(A) Confocal immunofluorescence analysis of HIV-1Gag (green), LC3 (red), and Lamp1 (blue) of DCs pretreated or not with chloroquine (10 μM) and exposed to HIV-1 for indicated times. White arrows indicated colocalization between HIV-1Gag (green) and LC3 (red). Data are representative of three independent experiments. (B) Magnification of areas of HIV-1Gag colocalizing with LC3+ positive structures indicated by white arrows in (A). (C) Quantification of autophagosomes (LC3+) colocalizing with HIV-1Gag at each indicated time in presence or absence of chloroquine (Chlq). Data are means of at least 20 cells per condition (±SD) at each time and representative of three independent experiments. (D) Quantification of lysosomes (Lamp1+) colocalizing with HIV-1Gag at each indicated time in presence or absence of chloroquine (Chlq). Data are means of at least 20 cells (±SD) per condition at each time and representative of three independent experiments. (E) Quantification of lysosomes (Lamp1+) colocalizing with autophagosomes (LC3+) at each indicated time in presence or absence of chloroquine (Chlq). Data are means of at least 20 cells (±SD) per condition at each time and representative of three independent experiments. (F–H) The same as in (C)–(E) respectively but during longer time points. Data are means of at least 15 cells and representative of two experiments. (I) DC exposed to HIV-1 for 120 min and processed as in (A). Z stack confocal analysis was done with slices of 1 μm. The image is from one field out of 20 and representative of three independent experiments.
Figure 4
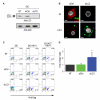
Figure 4. Autophagy Inhibition in DCs Leads to Increased Cell-Associated HIV-1 Gag
(A) Lysates of DCs nontransfected (NT), transfected with siCtrl, or transfected with siLC3 were immunoblotted with anti-LC3. LC3-I and LC3-II are indicated by arrows. Typical downregulation of LC3 expression in DCs with siLC3 ranged from 60% to 95%. (B) siCtrl DCs or siLC3 DCs unexposed or exposed for 20 hr with HIV-1 were processed for confocal immunofluorescence analysis and stained with anti-HIV-1Gag (green) and anti-LC3 (red). Scale bars represent 5 μm. (C) FACS analysis of HIV-1Gag intracellular staining in unexposed or DC exposed for 20 hr with HIV-1. DCs preincubated with AZT served as control to prevent viral replication. (D) Mean fold of increase of HIV-1Gag+ cells determined by FACS data from five different experiments. Nontransfected DC exposed with HIV-1 were set to an arbitrary value of 1. Error bars represent the mean ± SD of the five independent experiments.
Figure 5
Figure 5. Autophagy Inhibition in DCs Leads to Increased Viral Cell-to-Cell Transfer
(A) HIV-1 transfer (stained with anti-HIVGag) from nontransfected (NT), siCtrl, and siLC3 DCs to autologous CD4+ T cells (stained with anti-CD3) previously treated with indinavir (2 μg/ml). (B) Mean values (±SD) of NT, siCtrl, and siLC3 DC-mediated HIV-1 transfer to CD3+/CD4+ autologous T cells from four independent experiments with increasing amounts of viral input (2–200ng p24). (C) Trans-infection mediated by iDCs or mDCs pulsed with HIV-Luc/JRFL and treated or untreated with rapamycin (50 μg/ml) and then cocultured with CD4+ T cells (Hut-CCR5). Luciferase activities were quantified in cell lysates. Cps, counts per second. All data show the mean ± SD of duplicate or triplicate samples. One representative experiment out of three is shown.
Figure 6
Figure 6. RNA Interference or HIV-1-Mediated Autophagy Inhibition Dampen TLR4- and TLR8-Mediated Responses in DCs
(A) Immunoblot analysis of LC3 and ATG5 expression in lysates from siCtrl, siLC3, and siATG5 DCs. Arrows denote LC3-I and LC3-II migrating forms. (B) FACS analysis of TLR4-mediated intracellular TNF-α response upon 20 hr LPS stimulation of siCtrl, siLC3, or siATG5 DCs previously unexposed (NI) or pulsed with HIV-1 for 8 hr. BrefeldinA (10 μg/ml) was added 1 hr after adding LPS. (C) TNF-α responses upon 20 hr TLR4 stimulation in non-transfected (NT), siCtrl, siLC3, and siATG5 DCs. Response was normalized to nonstimulated NT-DCs, and depicted as fold increase over control. Data represented means (±SD) of fold increase in TNF-α responses from five independent experiments. (D) TNF-α responses in DCs exposed or not with HIV-1 for 8 hr and then stimulated with TLR8 agonist for 20 hr. Response was normalized to nonstimulated NT DCs and depicted as fold increase over control. Data represented means (±SD) of fold increase in TNF-α responses from five independent experiments. (E) FACS analysis of TLR4-mediated intracellular TNF-α response upon 20 hr LPS stimulation of nontransfected (NT), siCtrl, or siLC3 DCs previously unexposed (NI) or pulsed with HIV-1 or rgp120 (5 mg/ml) for 8 hr. BrefeldinA (10 mg/ml) was added 1 hr after adding LPS. Intracellular TNF-α response was normalized to unstimulated NT DCs and represented on a graph (right) as fold increase over control. One representative experiment out of three is shown. (F) DCs untreated (NI), or treated with HIV-1 or HIV-1-ΔEnv for 20 hr, were kept unstimulated or stimulated with LPS (1 μg/ml) for 15 min, in presence or absence of proteasome inhibitor Mg132 pretreatment when indicated (30 min at 1 μM). Lysates were then immunoblotted with anti-p176/180-IKKα/β, anti-IKK-α, anti-p32 IκB-α, anti-IκB-α, anti-p536 NF-κB, and anti-NF-κB. Sample loading was controlled with anti-actin. One representative experiment out of three is shown. (G) The same experiment as in 6F was done on siCtrl, siATG5, and siLC3 DCs. One representative experiment out of three is shown.
Figure 7
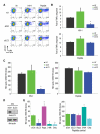
Figure 7. Autophagy-Deficient DCs Are Altered in HIV-1-Derived Antigen Processing and MHC Class II-Mediated Presentation to HIV-Specific T Cells
(A) FACS analysis of intracellular TNF-α response in HIV-specific CD4+ T cells (CD3+) upon 8 hr coculture with nontransfected (NT), siCtrl, and siLC3 DCs previously pulsed for 20 hr with 100 ng p24 HIV-Mn/AT2. A positive control was done in parallel with DC pulsed for 20 hr with cognate Gag peptide (0.5 μg/ml). BrefeldinA (10 μg/ml) was added 1 hr upon coculture. (B) Mean values of n-fold of increase of intracellular TNF-α responses from three independent experiments after pulsing DC with HIV-1 (upper) or Gag peptides (lower). Basal HIV-specific CD4+ T cells’ intracellular TNF-α expression was used as an arbitrary value of 1. (C) ELISPOT assays measuring HIV-specific CD4+ T cells’ IFN-γ responses upon coincubation for 36 hr with nontransfected (NT), siCtrl, and siLC3 DCs previously pulsed for 20 hr with 100 ng p24 HIV-Mn/AT2 (left) or Gag peptide (right). Mean values (±SD) from one representative experiment is shown. Results are representative of three experiments performed in triplicates. (D) Immunoblot analysis of LC3 expression in siCtrl and siLC3 DCs. Arrows indicate LC3-I and LC3-II. (E) HIV-specific CD4+ T cells IFN-γ responses measured by ELISPOT upon 36 hr coincubation with HIV-1 pulsed DCs previously transfected with siCtrl or siLC3 or pretreated for 2 hr with rapamycin (10 μM), 3-MA (1 mM), or chloroquine (20 μM). The right panel shows HIV-specific CD4+ T cells’ IFN-γ responses upon stimulation with Gag-peptide pulsed DCs. Experiments were done in triplicates (±SD).

Comment in

Similar articles

Cited by

References

    1. Alirezaei M, Kiosses WB, Flynn CT, Brady NR, Fox HS. Disruption of neuronal autophagy by infected microglia results in neurodegeneration. PLoS ONE. 2008;3:e2906. - PMC - PubMed
    1. Amer AO, Byrne BG, Swanson MS. Macrophages rapidly transfer pathogens from lipid raft vacuoles to autophagosomes. Autophagy. 2005;1:53–58. - PMC - PubMed
    1. Arrighi JF, Pion M, Garcia E, Escola JM, van Kooyk Y, Geijtenbeek TB, Piguet V. DC-SIGN-mediated infectious synapse formation enhances X4 HIV-1 transmission from dendritic cells to T cells. J. Exp. Med. 2004;200:1279–1288. - PMC - PubMed
    1. Brass AL, Dykxhoorn DM, Benita Y, Yan N, Engelman A, Xavier RJ, Lieberman J, Elledge SJ. Identification of host proteins required for HIV infection through a functional genomic screen. Science. 2008;319:921–926. - PubMed
    1. Buseyne F, Le Gall S, Boccaccio C, Abastado JP, Lifson JD, Arthur LO, Rivière Y, Heard JM, Schwartz O. MHC-I-restricted presentation of HIV-1 virion antigens without viral replication. Nat. Med. 2001;7:344–349. - PubMed

Publication types

MeSH terms

Substances