

GLUT1 and GLUT3 as potential prognostic markers for Oral Squamous Cell Carcinoma
- PMID: 20428049
- PMCID: PMC6257354
- DOI: 10.3390/molecules15042374
GLUT1 and GLUT3 as potential prognostic markers for Oral Squamous Cell Carcinoma
Abstract
We associated clinical-pathological features of 142 OSCC with the expression pattern of GLUT1 and GLUT3 in order to estimate their prognostic value.
Methods: Clinical-pathological features and overall survival data of 142 patients with Oral Squamous Cell Carcinoma (OSCC) were retrospectively reviewed from A.C.Camargo hospital records. A tissue microarray (TMA) was built for the immunohistochemical (IHC) analysis of GLUT 1 and GLUT 3. IHC results were evaluated according to the staining pattern and number of positive cells.
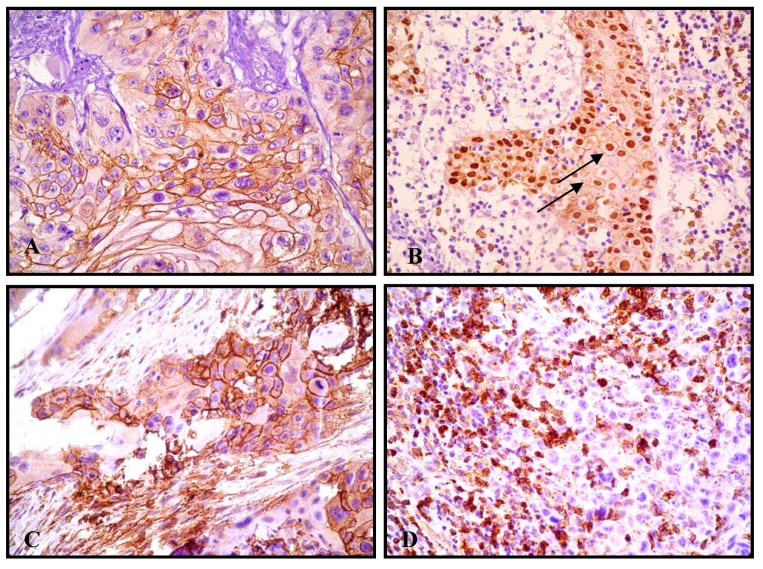
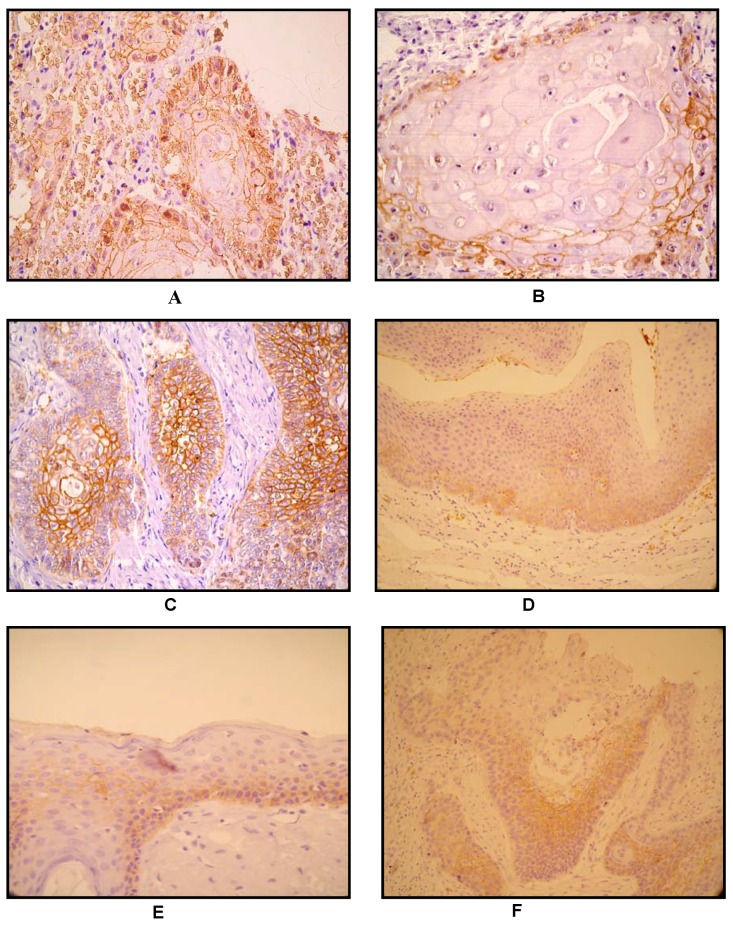
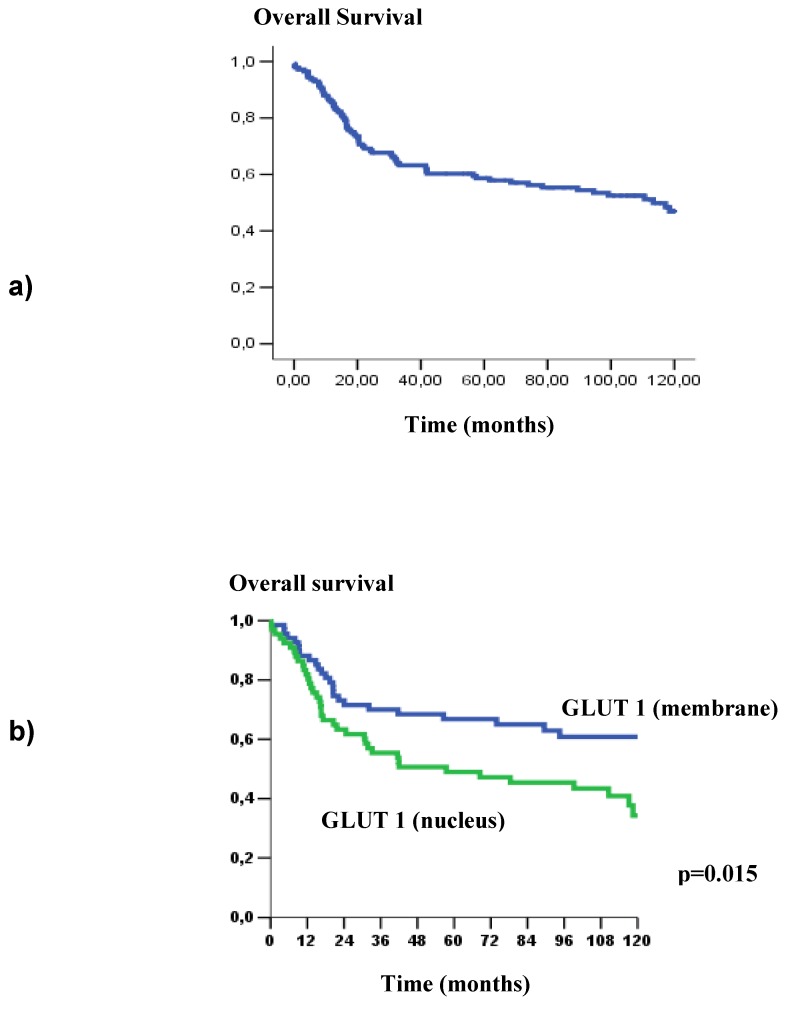
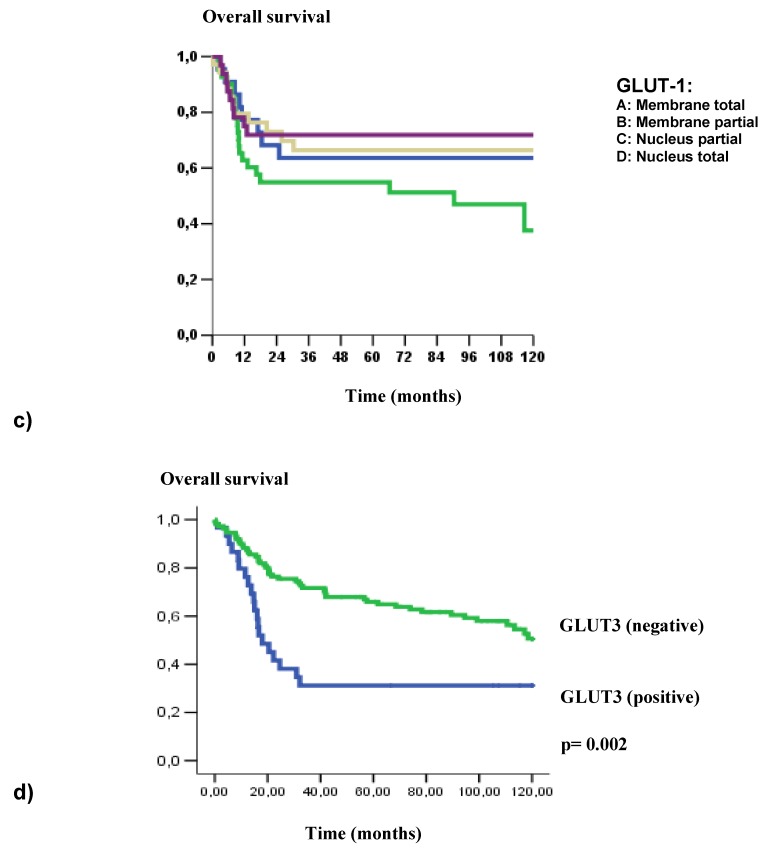
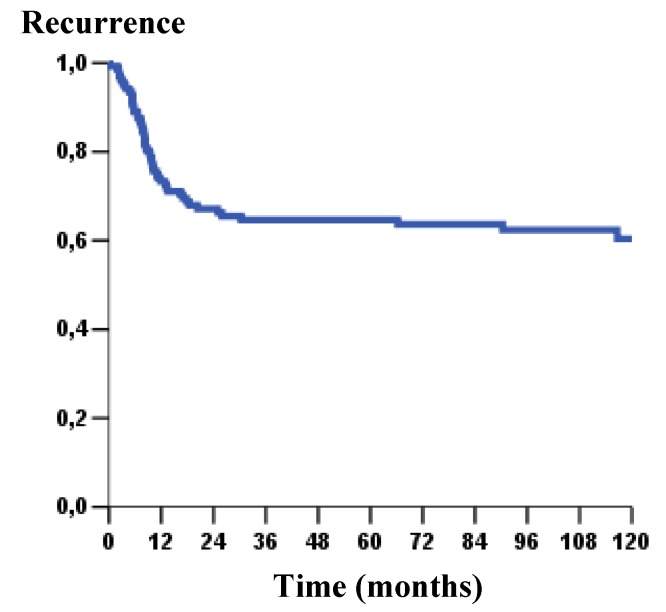
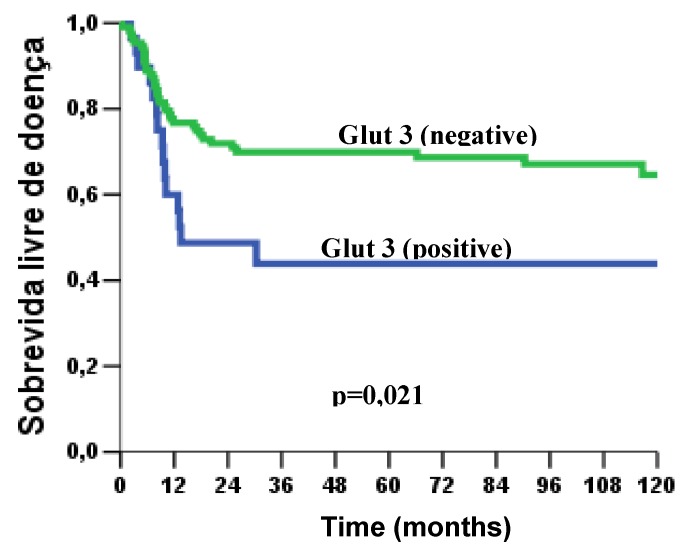
Results: GLUT 1 was over expressed in 50.3% of OSSC cases showing membrane staining pattern. However, nuclear expression was observed in 49.7% of the analyzed cases. GLUT 3 over expression was detected in 21.1% of OSCC cases. The pattern of GLUT 1 expression showed significant association with alcohol consumption (p = 0.004). Positive cell membrane GLUT 3 protein expression was associated with advanced clinic-staging of tumours (p = 0.005) as well as with vascular embolization (p = 0.005). Positive expression of GLUT 3 was associated with unfavorable free-disease survival (p = 0.021).
Conclusion: GLUT1 and GLUT3 protein expression evaluated by immunohistochemistry are, significantly, indicators of poor prognosis outcome in oral squamous cell carcinoma, probably due to the enhanced glycolytic metabolism of more aggressive neoplastic cells.
Figures
Similar articles
-
Immunohistochemical Evaluation of GLUT-3 and GLUT-4 in Oral Epithelial Dysplasia and Oral Squamous Cell Carcinoma.Asian Pac J Cancer Prev. 2018 Jul 27;19(7):1779-1783. doi: 10.22034/APJCP.2018.19.7.1779. Asian Pac J Cancer Prev. 2018. PMID: 30049187 Free PMC article.
-
Immunohistochemical Evaluation of Glucose Transporter Type 1 in Epithelial Dysplasia and Oral Squamous Cell Carcinoma.Asian Pac J Cancer Prev. 2016;17(1):147-51. doi: 10.7314/apjcp.2016.17.1.147. Asian Pac J Cancer Prev. 2016. PMID: 26838200
-
Coexpression of hypoxia-inducible factor-1α and glucose transporter-1 is associated with poor prognosis in oral squamous cell carcinoma patients.Histopathology. 2011 Jun;58(7):1136-47. doi: 10.1111/j.1365-2559.2011.03806.x. Epub 2011 Mar 25. Histopathology. 2011. PMID: 21438910
-
Prognostic value of GLUT-1 expression in oral squamous cell carcinoma: A prisma-compliant meta-analysis.Medicine (Baltimore). 2016 Nov;95(45):e5324. doi: 10.1097/MD.0000000000005324. Medicine (Baltimore). 2016. PMID: 27828852 Free PMC article. Review.
-
The Role of Glucose Transporters in Oral Squamous Cell Carcinoma.Biomolecules. 2021 Jul 21;11(8):1070. doi: 10.3390/biom11081070. Biomolecules. 2021. PMID: 34439735 Free PMC article. Review.
Cited by
-
Identification of Metabolism-Associated Biomarkers for Early and Precise Diagnosis of Oral Squamous Cell Carcinoma.Biomolecules. 2022 Mar 4;12(3):400. doi: 10.3390/biom12030400. Biomolecules. 2022. PMID: 35327590 Free PMC article. Review.
-
Gene and protein expression of glucose transporter 1 and glucose transporter 3 in human laryngeal cancer-the relationship with regulatory hypoxia-inducible factor-1α expression, tumor invasiveness, and patient prognosis.Tumour Biol. 2015 Apr;36(4):2309-21. doi: 10.1007/s13277-014-2838-4. Epub 2014 Nov 21. Tumour Biol. 2015. PMID: 25412955 Free PMC article.
-
Mutual impact of adipocytes and colorectal cancer cells growing in co-culture conditions.Cell Commun Signal. 2023 Jun 14;21(1):130. doi: 10.1186/s12964-023-01155-8. Cell Commun Signal. 2023. PMID: 37316878 Free PMC article.
-
Targeting the metabolic microenvironment of tumors.Adv Pharmacol. 2012;65:63-107. doi: 10.1016/B978-0-12-397927-8.00004-X. Adv Pharmacol. 2012. PMID: 22959024 Free PMC article. Review.
-
Effects of the Novel PFKFB3 Inhibitor KAN0438757 on Colorectal Cancer Cells and Its Systemic Toxicity Evaluation In Vivo.Cancers (Basel). 2021 Feb 28;13(5):1011. doi: 10.3390/cancers13051011. Cancers (Basel). 2021. PMID: 33671096 Free PMC article.
References
-
- Kallinowski F., Schlenger K.H., Runkel S., Kloes M., Stohrer M., Okunieff P., Vaupel P. Blood flow, metabolism, cellular microenvironment and growth rate of human tumor xenography. Cancer Res. 1989;49:3759–3764. - PubMed
-
- Reisser C., Eichhorn K., Herold-Mende C., Born A.I., Bannasch P. Expression of facilitative glucose transport proteins during development of squamous cell carcinomas of the head and neck. Int. J. Cancer. 1999;80:194–198. doi: 10.1002/(SICI)1097-0215(19990118)80:2<194::AID-IJC6>3.0.CO;2-M. - DOI - PubMed
-
- Haber R.S., Rathan A., Weiser K.R., Pritsker A., Itzkowitz S.H., Bodian C., Slater G., Weiss A., Burstein D.E. GLUT 1 Glucose transporter Expression in colorectal carcinoma: a marker for poor prognosis. Cancer. 1998;17:34–40. doi: 10.1002/(SICI)1097-0142(19980701)83:1<34::AID-CNCR5>3.0.CO;2-E. - DOI - PubMed
-
- Kunkel M., Reichert T.E., Benz P., Lehr H.A., Jeong J.H., Wieand S., Bartenstein P., Wagner W., Whiteside T.L. Over expression of GLUT 1 and increased glucose metabolism in tumors are associated with a poor prognosis in patients with oral squamous cell carcinoma. Cancer. 2003;15:1015–1024. doi: 10.1002/cncr.11159. - DOI - PubMed
Publication types
MeSH terms
Substances
LinkOut - more resources
Full Text Sources
Other Literature Sources
Medical
Miscellaneous
