Cytomegalovirus infection- and age-dependent changes in human CD8+ T-cell cytokine expression patterns
- PMID: 20427631
- PMCID: PMC2884431
- DOI: 10.1128/CVI.00455-09
Cytomegalovirus infection- and age-dependent changes in human CD8+ T-cell cytokine expression patterns
Abstract
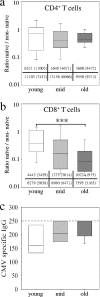
T cells are strongly affected by immune aging, a phenomenon that leads to increased susceptibility to infections and decreased vaccination efficacy in elderly individuals. Cytomegalovirus (CMV) infection induces vigorous T-cell immune responses in humans and is thought to be a driving force of immune aging. In the present study we analyzed CMV-induced quantitative and qualitative differences in the cytokine-expressing T-cell repertoire from individuals of different age groups after in vitro stimulation. The CMV pp65 peptide pool and the superantigen Staphylococcus enterotoxin B (SEB) induced higher proportions of CD8+ effector T cells expressing gamma interferon (IFN-gamma), tumor necrosis factor alpha (TNF-alpha), and granulocyte-macrophage colony-stimulating factor in the oldest study group, while only SEB induced increased responses in the middle-aged study group. Notably, CMV-specific multiple cytokine expression patterns revealed higher proportions of IFN-gamma- and TNF-alpha-coexpressing CD8+ T cells exclusively in the oldest study group. These qualitative differences were absent in SEB-induced CD8+ effector T cells, although quantitative differences were detected. We report age-dependent qualitative changes in CMV-specific CD8+ T-cell cytokine patterns which are biocandidate markers of immune exhaustion in elderly individuals.
Figures


Similar articles
-
Maintenance of CMV-specific CD8+ T cell responses and the relationship of IL-27 to IFN-γ levels with aging.Cytokine. 2013 Feb;61(2):485-90. doi: 10.1016/j.cyto.2012.11.024. Epub 2012 Dec 29. Cytokine. 2013. PMID: 23280240 Free PMC article.
-
Co-ordinated isolation of CD8(+) and CD4(+) T cells recognizing a broad repertoire of cytomegalovirus pp65 and IE1 epitopes for highly specific adoptive immunotherapy.Cytotherapy. 2010 Nov;12(7):933-44. doi: 10.3109/14653240903505822. Cytotherapy. 2010. PMID: 20078388
-
T-bet:Eomes balance, effector function, and proliferation of cytomegalovirus-specific CD8+ T cells during primary infection differentiates the capacity for durable immune control.J Immunol. 2014 Dec 1;193(11):5709-5722. doi: 10.4049/jimmunol.1401436. Epub 2014 Oct 22. J Immunol. 2014. PMID: 25339676 Free PMC article.
-
Analyzing T-cell responses to cytomegalovirus by cytokine flow cytometry.Hum Immunol. 2004 May;65(5):493-9. doi: 10.1016/j.humimm.2004.02.004. Hum Immunol. 2004. PMID: 15172449 Review.
-
Cytomegalovirus (CMV)-specific CD8+ T cells in individuals with HIV infection: correlation with protection from CMV disease.J Antimicrob Chemother. 2006 Apr;57(4):585-8. doi: 10.1093/jac/dkl049. Epub 2006 Feb 27. J Antimicrob Chemother. 2006. PMID: 16504998 Review.
Cited by
-
The polyfunctionality of human memory CD8+ T cells elicited by acute and chronic virus infections is not influenced by age.PLoS Pathog. 2012;8(12):e1003076. doi: 10.1371/journal.ppat.1003076. Epub 2012 Dec 13. PLoS Pathog. 2012. PMID: 23271970 Free PMC article. Clinical Trial.
-
GM-CSF production allows the identification of immunoprevalent antigens recognized by human CD4+ T cells following smallpox vaccination.PLoS One. 2011;6(9):e24091. doi: 10.1371/journal.pone.0024091. Epub 2011 Sep 9. PLoS One. 2011. PMID: 21931646 Free PMC article.
-
A Cell for the Ages: Human γδ T Cells across the Lifespan.Int J Mol Sci. 2020 Nov 24;21(23):8903. doi: 10.3390/ijms21238903. Int J Mol Sci. 2020. PMID: 33255339 Free PMC article. Review.
-
Methods for Characterization of Senescent Circulating and Tumor-Infiltrating T-Cells: An Overview from Multicolor Flow Cytometry to Single-Cell RNA Sequencing.Methods Mol Biol. 2021;2325:79-95. doi: 10.1007/978-1-0716-1507-2_6. Methods Mol Biol. 2021. PMID: 34053052 Review.
-
Dominant TNFα and impaired IL-2 cytokine profiles of CD4+ T cells from children with type-1 diabetes.Immunol Cell Biol. 2017 Aug;95(7):630-639. doi: 10.1038/icb.2017.24. Epub 2017 Apr 5. Immunol Cell Biol. 2017. PMID: 28377612
References
-
- Bunde, T., A. Kirchner, B. Hoffmeister, D. Habedank, R. Hetzer, G. Cherepnev, S. Proesch, P. Reinke, H. D. Volk, H. Lehmkuhl, and F. Kern. 2005. Protection from cytomegalovirus after transplantation is correlated with immediate early 1-specific CD8 T cells. J. Exp. Med. 201:1031-1036. - PMC - PubMed
-
- Candore, G., G. Di Lorenzo, M. Melluso, D. Cigna, A. T. Colucci, M. A. Modica, and C. Caruso. 1993. γ-Interferon, interleukin-4 and interleukin-6 in vitro production in old subjects. Autoimmunity 16:275-280. - PubMed
-
- Darrah, P. A., D. T. Patel, P. M. De Luca, R. W. Lindsay, D. F. Davey, B. J. Flynn, S. T. Hoff, P. Andersen, S. G. Reed, S. L. Morris, M. Roederer, and R. A. Seder. 2007. Multifunctional TH1 cells define a correlate of vaccine-mediated protection against Leishmania major. Nat. Med. 13:843-850. - PubMed
-
- Fagiolo, U., A. Cossarizza, E. Scala, E. Fanales-Belasio, C. Ortolani, E. Cozzi, D. Monti, C. Franceschi, and R. Paganelli. 1993. Increased cytokine production in mononuclear cells of healthy elderly people. Eur. J. Immunol. 23:2375-2378. - PubMed
-
- Fletcher, J. M., M. Vukmanovic-Stejic, P. J. Dunne, K. E. Birch, J. E. Cook, S. E. Jackson, M. Salmon, M. H. Rustin, and A. N. Akbar. 2005. Cytomegalovirus-specific CD4+ T cells in healthy carriers are continuously driven to replicative exhaustion. J. Immunol. 175:8218-8225. - PubMed
MeSH terms
Substances
LinkOut - more resources
Full Text Sources
Medical
Research Materials

