Analysis of an insertion mutation in a cohort of 94 patients with spinocerebellar ataxia type 31 from Nagano, Japan
- PMID: 20424877
- PMCID: PMC2944954
- DOI: 10.1007/s10048-010-0245-6
Analysis of an insertion mutation in a cohort of 94 patients with spinocerebellar ataxia type 31 from Nagano, Japan
Abstract
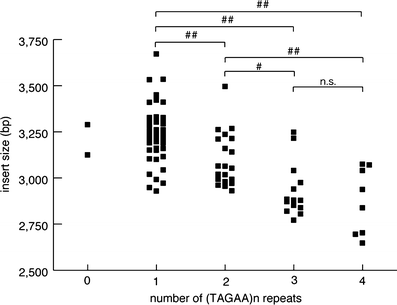
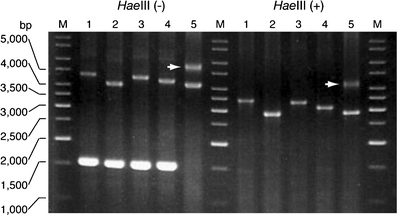
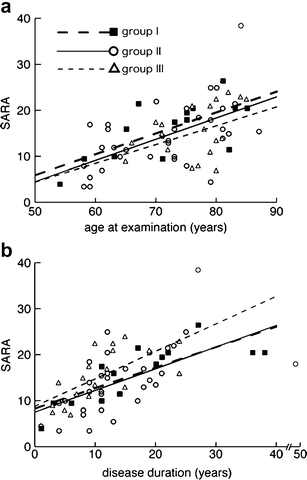
Spinocerebellar ataxia type 31 (SCA31) is a recently defined subtype of autosomal dominant cerebellar ataxia (ADCA) characterized by adult-onset, pure cerebellar ataxia. The C/T substitution in the 5'-untranslated region of the puratrophin-1 gene (PLEKHG4) or a disease-specific haplotype within the 900-kb SCA31 critical region just upstream of PLEKHG4 has been used for the diagnosis of SCA31. Very recently, a disease-specific insertion containing penta-nucleotide (TGGAA)(n) repeats has been found in this critical region in SCA31 patients. SCA31 was highly prevalent in Nagano, Japan, where SCA31 accounts for approximately 42% of ADCA families. We screened the insertion in 94 SCA31 patients from 71 families in Nagano. All patients had a 2.6- to 3.7-kb insertion. The size of the insertion was inversely correlated with the age at onset but not associated with the progression rate after onset. (TAGAA)(n) repeats at the 5'-end of the insertion were variable in number, ranging from 0 (without TAGAA sequence) to 4. The number of (TAGAA)(n) repeats was inversely correlated to the total size of the insertion. The number of (TAGAA)(n) repeats was comparatively uniform within patients from the three endemic foci in Nagano. Only one patient, heterozygous for the C/T substitution in PLEKHG4, had the insertions in both alleles; they were approximately 3.0 and 4.3 kb in size. Sequencing and Southern hybridization using biotin-labeled (TGGAA)(5) probe strongly indicated that the 3.0-kb insertion, but not the 4.3-kb insertion, contained (TGGAA)(n) stretch. We also found that 3 of 405 control individuals (0.7%) had the insertions from 1.0 to 3.5 kb in length. They were negative for the C/T substitution in PLEKHG4, and neither of the insertions contained (TGGAA)(n) stretch at their 5'-end by sequencing. The insertions in normal controls were clearly detected by Southern hybridization using (TAAAA)(5) probe, while they were not labeled with (TGGAA)(5) or (TAGAA)(5) probe. These data indicate that control alleles very rarely have a nonpathogenic large insertion in the SCA31 critical region and that not only the presence of the insertion but also its size is not sufficient evidence for a disease-causing allele. We approve of the view that (TGGAA)(n) repeats in the insertion are indeed related to the pathogenesis of SCA31, but it remains undetermined whether a large insertion lacking (TGGAA)(n) is nonpathogenic.
Figures


Similar articles
-
Spinocerebellar ataxia type 31 is associated with "inserted" penta-nucleotide repeats containing (TGGAA)n.Am J Hum Genet. 2009 Nov;85(5):544-57. doi: 10.1016/j.ajhg.2009.09.019. Epub 2009 Oct 29. Am J Hum Genet. 2009. PMID: 19878914 Free PMC article.
-
Abnormal RNA structures (RNA foci) containing a penta-nucleotide repeat (UGGAA)n in the Purkinje cell nucleus is associated with spinocerebellar ataxia type 31 pathogenesis.Neuropathology. 2013 Dec;33(6):600-11. doi: 10.1111/neup.12032. Epub 2013 Apr 22. Neuropathology. 2013. PMID: 23607545
-
[Spinocerebellar ataxia type 31].Rinsho Shinkeigaku. 2010 Nov;50(11):985-7. doi: 10.5692/clinicalneurol.50.985. Rinsho Shinkeigaku. 2010. PMID: 21921537 Review. Japanese.
-
Molecular Mechanisms and Future Therapeutics for Spinocerebellar Ataxia Type 31 (SCA31).Neurotherapeutics. 2019 Oct;16(4):1106-1114. doi: 10.1007/s13311-019-00804-6. Neurotherapeutics. 2019. PMID: 31755042 Free PMC article. Review.
-
Two dominantly inherited ataxias linked to chromosome 16q22.1: SCA4 and SCA31 are not allelic.J Neurol. 2011 Jul;258(7):1223-7. doi: 10.1007/s00415-011-5905-4. Epub 2011 Jan 26. J Neurol. 2011. PMID: 21267591
Cited by
-
Midbrain atrophy related to parkinsonism in a non-coding repeat expansion disorder: five cases of spinocerebellar ataxia type 31 with nigrostriatal dopaminergic dysfunction.Cerebellum Ataxias. 2021 Mar 30;8(1):11. doi: 10.1186/s40673-021-00134-4. Cerebellum Ataxias. 2021. PMID: 33785066 Free PMC article.
-
Clinical analysis of adult-onset spinocerebellar ataxias in Thailand.BMC Neurol. 2014 Apr 5;14:75. doi: 10.1186/1471-2377-14-75. BMC Neurol. 2014. PMID: 24708620 Free PMC article.
-
Spinocerebellar ataxia type 36 in the Han Chinese.Neurol Genet. 2016 Apr 12;2(3):e68. doi: 10.1212/NXG.0000000000000068. eCollection 2016 Jun. Neurol Genet. 2016. PMID: 27123487 Free PMC article.
-
Plekhg4 is a novel Dbl family guanine nucleotide exchange factor protein for rho family GTPases.J Biol Chem. 2013 May 17;288(20):14522-14530. doi: 10.1074/jbc.M112.430371. Epub 2013 Apr 9. J Biol Chem. 2013. PMID: 23572525 Free PMC article.
-
Genetic Movement Disorders Commonly Seen in Asians.Mov Disord Clin Pract. 2023 May 8;10(6):878-895. doi: 10.1002/mdc3.13737. eCollection 2023 Jun. Mov Disord Clin Pract. 2023. PMID: 37332644 Free PMC article. Review.
References
-
- Ishikawa K, Toru S, Tsunemi T, Li M, Kobayashi K, Yokota T, et al. An autosomal dominant cerebellar ataxia linked to chromosome 16q22.1 is associated with a single-nucleotide substitution in the 5′ untranslated region of the gene encoding a protein with spectrin repeat and rho guanine-nucleotide exchange-factor domains. Am J Hum Genet. 2005;77:280–296. doi: 10.1086/432518. - DOI - PMC - PubMed
Publication types
MeSH terms
Substances
LinkOut - more resources
Full Text Sources
Other Literature Sources
Molecular Biology Databases

