

GTP-dependent heteropolymer formation and bundling of chloroplast FtsZ1 and FtsZ2
- PMID: 20421292
- PMCID: PMC2898327
- DOI: 10.1074/jbc.M110.122614
GTP-dependent heteropolymer formation and bundling of chloroplast FtsZ1 and FtsZ2
Abstract
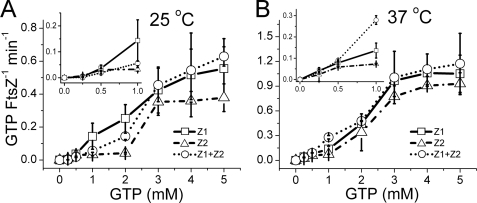
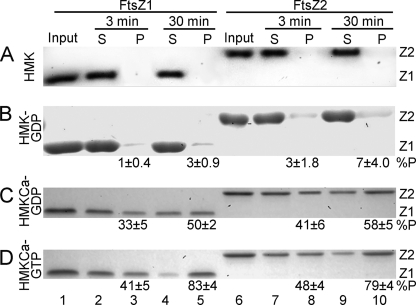
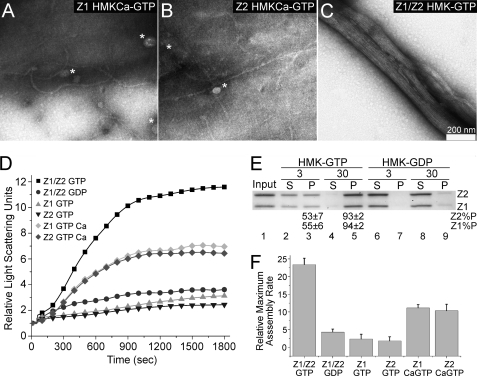
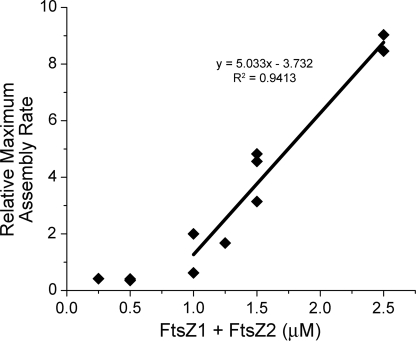
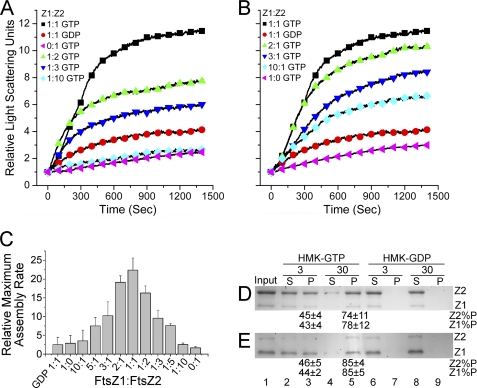
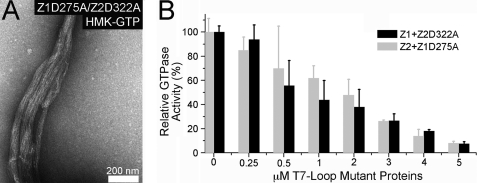
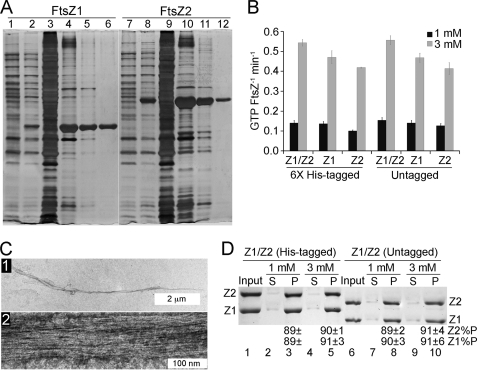
Bacteria and chloroplasts require the ring-forming cytoskeletal protein FtsZ for division. Although bacteria accomplish division with a single FtsZ, plant chloroplasts require two FtsZ types for division, FtsZ1 and FtsZ2. These proteins colocalize to a mid-plastid Z ring, but their biochemical relationship is poorly understood. We investigated the in vitro behavior of recombinant FtsZ1 and FtsZ2 separately and together. Both proteins bind and hydrolyze GTP, although GTPase activities are low compared with the activity of Escherichia coli FtsZ. Each protein undergoes GTP-dependent assembly into thin protofilaments in the presence of calcium as a stabilizing agent, similar to bacterial FtsZ. In contrast, when mixed without calcium, FtsZ1 and FtsZ2 exhibit slightly elevated GTPase activity and coassembly into extensively bundled protofilaments. Coassembly is enhanced by FtsZ1, suggesting that it promotes lateral interactions between protofilaments. Experiments with GTPase-deficient mutants reveal that FtsZ1 and FtsZ2 form heteropolymers. Maximum coassembly occurs in reactions containing equimolar FtsZ1 and FtsZ2, but significant coassembly occurs at other stoichiometries. The FtsZ1:FtsZ2 ratio in coassembled structures mirrors their input ratio, suggesting plasticity in protofilament and/or bundle composition. This behavior contrasts with that of alpha- and beta-tubulin and the bacterial tubulin-like proteins BtubA and BtubB, which coassemble in a strict 1:1 stoichiometry. Our findings raise the possibility that plasticity in FtsZ filament composition and heteropolymerization-induced bundling could have been a driving force for the coevolution of FtsZ1 and FtsZ2 in the green lineage, perhaps arising from an enhanced capacity for the regulation of Z ring composition and activity in vivo.
Figures
Similar articles
-
In vivo quantitative relationship between plastid division proteins FtsZ1 and FtsZ2 and identification of ARC6 and ARC3 in a native FtsZ complex.Biochem J. 2008 Jun 1;412(2):367-78. doi: 10.1042/BJ20071354. Biochem J. 2008. PMID: 18284374
-
The Arabidopsis thaliana chloroplast division protein FtsZ1 counterbalances FtsZ2 filament stability in vitro.J Biol Chem. 2021 Jan-Jun;296:100627. doi: 10.1016/j.jbc.2021.100627. Epub 2021 Apr 2. J Biol Chem. 2021. PMID: 33812992 Free PMC article.
-
Distinct functions of chloroplast FtsZ1 and FtsZ2 in Z-ring structure and remodeling.J Cell Biol. 2012 Nov 12;199(4):623-37. doi: 10.1083/jcb.201205114. Epub 2012 Nov 5. J Cell Biol. 2012. PMID: 23128242 Free PMC article.
-
Chloroplast division protein ARC3 regulates chloroplast FtsZ-ring assembly and positioning in arabidopsis through interaction with FtsZ2.Plant Cell. 2013 May;25(5):1787-802. doi: 10.1105/tpc.113.111047. Epub 2013 May 28. Plant Cell. 2013. PMID: 23715471 Free PMC article.
-
[FtsZ and the division of bacterial cell].Tsitologiia. 2007;49(5):421-9. Tsitologiia. 2007. PMID: 17654828 Review. Russian.
Cited by
-
Evolution and Functional Differentiation of the C-terminal Motifs of FtsZs During Plant Evolution.Mol Biol Evol. 2024 Jul 3;41(7):msae145. doi: 10.1093/molbev/msae145. Mol Biol Evol. 2024. PMID: 39004892 Free PMC article.
-
ARC3 Activation by PARC6 Promotes FtsZ-Ring Remodeling at the Chloroplast Division Site.Plant Cell. 2019 Apr;31(4):862-885. doi: 10.1105/tpc.18.00948. Epub 2019 Mar 1. Plant Cell. 2019. PMID: 30824505 Free PMC article.
-
ARC6-mediated Z ring-like structure formation of prokaryote-descended chloroplast FtsZ in Escherichia coli.Sci Rep. 2017 Jun 14;7(1):3492. doi: 10.1038/s41598-017-03698-6. Sci Rep. 2017. PMID: 28615720 Free PMC article.
-
Bacterial Heterologous Expression System for Reconstitution of Chloroplast Inner Division Ring and Evaluation of Its Contributors.Int J Mol Sci. 2018 Feb 11;19(2):544. doi: 10.3390/ijms19020544. Int J Mol Sci. 2018. PMID: 29439474 Free PMC article. Review.
-
Roles of Arabidopsis PARC6 in Coordination of the Chloroplast Division Complex and Negative Regulation of FtsZ Assembly.Plant Physiol. 2016 Jan;170(1):250-62. doi: 10.1104/pp.15.01460. Epub 2015 Nov 2. Plant Physiol. 2016. PMID: 26527658 Free PMC article.
References
Publication types
MeSH terms
Substances
LinkOut - more resources
Full Text Sources
