. 2010 May;11(5):601-15.
doi: 10.1111/j.1600-0854.2010.01046.x. Epub 2010 Feb 22.

Improvement in lipid and protein trafficking in Niemann-Pick C1 cells by correction of a secondary enzyme defect

Affiliations

Improvement in lipid and protein trafficking in Niemann-Pick C1 cells by correction of a secondary enzyme defect

Cecilia Devlin et al. Traffic. 2010 May.

Abstract

Different primary lysosomal trafficking defects lead to common alterations in lipid trafficking, suggesting cooperative interactions among lysosomal lipids. However, cellular analysis of the functional consequences of this phenomenon is lacking. As a test case, we studied cells with defective Niemann-Pick C1 (NPC1) protein, a cholesterol trafficking protein whose defect gives rise to lysosomal accumulation of cholesterol and other lipids, leading to NPC disease. NPC1 cells also develop a secondary defect in acid sphingomyelinase (SMase) activity despite a normal acid SMase gene (SMPD1). When acid SMase activity was restored to normal levels in NPC1-deficient CHO cells through SMPD1 transfection, there was a dramatic reduction in lysosomal cholesterol. Two other defects, excess lysosomal bis-(monoacylglycerol) phosphate (BMP) and defective transferrin receptor (TfR) recycling, were also markedly improved. To test its relevance in human cells, the acid SMase activity defect in fibroblasts from NPC1 patients was corrected by SMPD1 transfection or acid SMase enzyme replacement. Both treatments resulted in a dramatic reduction in lysosomal cholesterol. These data show that correcting one aspect of a complex lysosomal lipid storage disease can reduce the cellular consequences even if the primary genetic defect is not corrected.


Figures
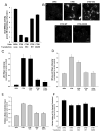
Figure 1
Figure 1
Decrease in cholesterol accumulation in LSOs by restoration of acid SMase activity in CT60 cells. A) CT60 cells were transfected with empty vector (VEC) or with vector containing either the WT or the C629S SMPD1 cDNA constructs. Two days later, extracts of these cells and non-transfected 25RA and CT60 cells were assayed for acid SMase activity. The activity levels in CT60-WT and CT60-C629S cells were significantly different from those in non-transfected CT60 cells and CT60-VEC cells (p < 0.0001). B) The five cell groups described in (A) were fixed and stained with filipin. The images are displayed with the same gray scale range. Scale bar, 20 μm. C) Quantification of filipin fluorescence in the LSOs and D) in whole cells. Each bar in the data quantification represents the average of 30 images from two independent experiments ±SEM. The CT60-WT and CT60-C629S values were significantly different from the CT60 and CT60-VEC values (p < 0.0001). NB: The 25RA and CT60 cells used in this experiment are the same ones used in Figure 4, i.e. they express the hTfR. However, they have the same level of cholesterol accumulation in LSOs and the same response to acid SMase restoration as cells not expressing the TfR (data not shown). E) Free cholesterol levels in each of the five cell groups described in (A) were assayed by gas chromatography. Each bar represents an average of four samples from two independent experiments and is normalized to CT60-VEC value, which was 45.7 ± 1.7 μg cholesterol/mg cell protein. The CT60-WT and CT60-C629S values were significantly different from the CT60 and CT60-VEC values (p < 0.0001). F) Monolayers of the five groups of cells described above were incubated for 2 h with 5 μg/mL LDL reconstituted with [14C]cholesteryl ester (CE). Lipid extracts of the cells were then fractionated by thin-layer chromatography, and the areas of the plate corresponding to cholesterol and CE, which accounted for all of the radioactivity, were scraped and counted for [14C]cpm. [14C]cholesterol represents hydrolyzed LDL–CE in the cells, and [14C]CE represents either unhydrolyzed LDL–CE or hydrolyzed LDL-cholesterol that was re-esterified in the cells to CE. The data shown are derived from the total LDL-derived cholesterol in the cells (free cholesterol + CE) and are mean of 5 values ±SEM. The values for cellular-free cholesterol derived from LDL were similar among all the five cell types: 1.92, 1.88, 1.93, 2.05, 1.72 pmol/μg cell protein, respectively. None of the differences in total or free LDL-derived cellular cholesterol among the five groups of cells reached statistical significance.
Figure 2
Figure 2
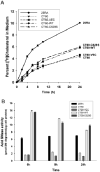
Partial correction of efflux of LDL-derived [3H]cholesterol from CT60 cells by restoration of acid SMase activity. A) Monolayers of 25RA, CT60, CT60-VEC, CT60-WT and CT60-C629S were incubated for 4 h in serum-free medium containing 10 μg/mL [3H]CE-labeled LDL. The cells were then rinsed and incubated with fresh medium containing 50 μg/mL HDL3 for the indicated times. Tritium radioactivity in the media and cells was measured to calculate the percent [3H]cholesterol in the medium. The values for CT60-WT and CT60-C629S cells were significantly different from the other three values at 24 h (p < 0.005). B) The bottom graph shows acid SMase activity in the five groups of cells at 0, 8 and 24 h after incubation in conditions nearly identical to those in (A), except that cells were incubated with unlabeled LDL. The values for CT60-WT and CT60-C629S cells were significantly different from that of CT60 and CT60-VEC (p <0.005).
Figure 3
Figure 3
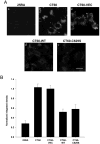
Decrease in BMP accumulation in CT60 cells by restoration of acid SMase activity. A) Anti-BMP immunofluorescence in 25RA, CT60, CT60-VEC, CT60-WT and CT60-C629S cells. Scale bar, 20 μm. B) Quantitation of anti-BMP immunofluorescence intensity. Each bar in the data quantification represents the average of 20 images from two independent experiments ±SEM. The values for CT60-WT and CT60-C629S cells were significantly different from that of CT60 and CT60-VEC cells (p < 0.01). NB: As in Figure 1, the cells used here express the hTfR, but they have the same level of BMP accumulation in LSOs and the same response to acid SMase restoration as the cells not expressing the TfR (data not shown).
Figure 4
Figure 4
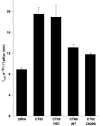
Recycling of the transferrin receptor in CT60 cells is improved by restoration of acid SMase activity. The efflux kinetics of [125I]-transferrin was measured in 25RA, CT60, CT60-VEC, CT60-WT and CT60-C629S cells expressing the hTfR, as described in Materials and Methods. The values for CT60-WT and CT60-C629S cells were significantly different from that of CT60 and CT60-VEC cells (p < 0.05).
Figure 5
Figure 5
Decrease in cholesterol accumulation in LSOs by genetic restoration of acid SMase activity in human fibroblasts. A) Human WT (GM05659) and NPC (GM03123) Fbs were left untransfected or were transiently transfected with empty GFP-expressing vector (VEC) or with GFP-vector containing either WT or C629S SMPD1 cDNA constructs. Two days later, the cells were washed with PBS, fixed and stained with filipin. Standard UV and FITC filters were used for filipin imaging (all cells) or GFP imaging (transfected cells), respectively. The displayed filipin images and GFP images are on the same gray scale range, respectively. Scale bar, 30 μm. B) The bar graph shows LSO ratio values normalized to the NPC-VEC values (average of 20–30 images from three independent experiments ±SEM). The values for NPC and NPC-VEC fibroblasts were significantly different from those for NPC-WT and NPC-C629S fibroblasts (p < 0.0001).
Figure 6
Figure 6
Exogenous acid SMase decreases cholesterol accumulation in LSOs in human NPC fibroblasts. Parallel sets of human WT (GM05659) and NPC (GM03123) Fbs were incubated in medium alone or, in the case of the NPC fibroblasts, medium containing 3 μg/mL recombinant human acid SMase (rhASM). Two days later, the cells were washed thoroughly with PBS and either lysed and assayed for acid SMase activity (A) or fixed and stained with filipin for imaging and quantification (B). The images are displayed with the same gray scale range. Scale bar, 15 μm. The quantified data in the bar graph represent LSO ratios normalized to the WT Fb values (average of 60–66 images from three independent experiments ±SEM). C) Another human NPC Fbs (GM18453) was incubated with 3 μg/mL rhASM for 24 h, unlike 48 h in NPC1 (GM03123). Quantified data shown in bar chart are the normalized LSO ratios (normalized to untreated NPC Fbs) in the presence and absence of recombinant enzyme. Data represents an average from two independent experiments and 30–36 images ±SEM, p < 0.0001. The values for NPC fibroblasts in panels A, B and C were significantly different from both the WT Fbs and the NPC fibroblasts treated with rhASM (p < 0.0001).
Figure 7
Figure 7
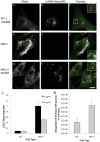
Addition of Alexa555-conjugated rhASM to demonstrate sub-cellular localization of exogenous acid SMase. WT (GM5659) and NPC (GM03123) Fbs were incubated with or without 3 μg/mL Alexa555-conjugated rhASM for 24 h. To remove surface-bound label, the cells were further incubated for 15 min with a growth medium without the enzyme. Finally, the cells were washed with PBS, fixed with 1.5% PFA and stained with filipin for imaging and quantification. The uptake of rhASM–Alexa555 was completely blocked when enzyme was added in the presence of excess mannose-6-phosphate (10 mm) (data not shown). Filipin images in panels (A, D and G) and the Alexa555 images in panel (B, E and H) for WT, NPC1 and NPC1 + rhASM –Alexa 555, respectively, are displayed on the same gray scale range. Color overlays for filipin (green) and rhASM–Alexa555 (red) are shown in panels (C, F and I). The images in the inset are the zoomed color overlays of the region marked in (C, F and I). Scale bar = 10 μm. Panel (J) shows the quantification of LSO filipin intensity after incubation with 0 or 3 μg/mL Alexa555-conjugated rhASM for 24 h in WT and NPC (GM03123) Fbs (values are ±SEM, p < 0.001). Conjugation of Alexa555 to the enzyme did not affect its activity. Panel (K) shows the quantification of rhASM uptake after incubation with 0 and 3 μg/mL Alexa555-conjugated rhASM for 24 h in WT and NPC (GM03123) Fbs (values are ±SEM, p < 0.05).
Figure 8
Figure 8
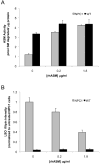
Decreased LSO cholesterol accumulation and increased acid SMase activity are achieved in NPC1 human fibroblasts by increasing amounts of rhASM. WT (GM5659) and NPC (GM03123) Fbs were incubated with 0, 0.2 and 1.8 μg/mL rhASM for 24 h. To remove surface-bound label, the cells were further incubated for 15 min with growth medium without the enzyme. The cells were washed thoroughly with PBS and either lysed and assayed for acid SMase activity (A) or fixed and stained with filipin for imaging and quantification (B). Each data point in plot (A) is representative of three wells in an experiment, p < 0.05. Plot (B) represents LSO ratios normalized to the untreated NPC Fb GM01323 values (average of 16–20 images from two independent experiments ±SEM), p < 0.005.
Figure 9
Figure 9
Working model of how acid SMase ameliorates the trafficking defects in NPC1-deficient cells. The primary defect in cholesterol trafficking caused by mutant NPC1 leads to a secondary decrease in acid SMase activity. The decrease in acid SMase activity causes an increase in intracellular SM, presumably in late endosomes and possibly other sites, which amplifies the original cholesterol trafficking defect. Moreover, cholesterol accumulation in the LSO and perhaps other effects of NPC1 deficiency are associated with trafficking defects in other lipids, such as BMP, and perturbation of vesicular trafficking of membrane proteins, including TfR recycling. Thus, these defects would also be amplified by the secondary decrease in acid SMase activity. Restoring the defect in acid SMase activity breaks the amplification cycle and thus helps correct the aforementioned lipid and protein trafficking defects. See text for details.

Similar articles

Cited by

References

    1. Brady RO. Lysosomal storage diseases. Pharmacol Ther. 1982;19:327–336. - PubMed
    1. Neufeld EF. Lysosomal storage diseases. Annu Rev Biochem. 1991;60:257–280. - PubMed
    1. Puri V, Watanabe R, Dominguez M, Sun X, Wheatley CL, Marks DL, Pagano RE. Cholesterol modulates membrane traffic along the endocytic pathway in sphingolipid-storage diseases. Nat Cell Biol. 1999;1:386–388. - PubMed
    1. Lloyd-Evans E, Morgan AJ, He X, Smith DA, Elliot-Smith E, Sillence DJ, Churchill GC, Schuchman EH, Galione A, Platt FM. Niemann-Pick disease type C1 is a sphingosine storage disease that causes deregulation of lysosomal calcium. Nat Med. 2008;14:1247–1255. - PubMed
    1. Cheruku SR, Xu Z, Dutia R, Lobel P, Storch J. Mechanism of cholesterol transfer from the Niemann-Pick type C2 protein to model membranes supports a role in lysosomal cholesterol transport. J Biol Chem. 2006;281:31594–31604. - PubMed

Publication types

MeSH terms