. 2010 Jul;84(13):6425-37.
doi: 10.1128/JVI.01519-09. Epub 2010 Apr 21.

Establishment of HIV latency in primary CD4+ cells is due to epigenetic transcriptional silencing and P-TEFb restriction

Affiliations

Establishment of HIV latency in primary CD4+ cells is due to epigenetic transcriptional silencing and P-TEFb restriction

Mudit Tyagi et al. J Virol. 2010 Jul.

Abstract

The development of suitable experimental systems for studying HIV latency in primary cells that permit detailed biochemical analyses and the screening of drugs is a critical step in the effort to develop viral eradication strategies. Primary CD4(+) T cells were isolated from peripheral blood and amplified by antibodies to the T-cell receptor (TCR). The cells were then infected by lentiviral vectors carrying fluorescent reporters and either the wild-type Tat gene or the attenuated H13L Tat gene. After sorting for the positive cells and reamplification, the infected cells were allowed to spontaneously enter latency by long-term cultivation on the H80 feeder cell line in the absence of TCR stimulation. By 6 weeks almost all of the cells lost fluorescent protein marker expression; however, more than 95% of these latently infected cells could be reactivated after stimulation of the TCR by alpha-CD3/CD28 antibodies. Chromatin immunoprecipitation assays showed that, analogously to Jurkat T cells, latent proviruses in primary CD4(+) T cells are enriched in heterochromatic markers, including high levels of CBF-1, histone deacetylases, and methylated histones. Upon TCR activation, there was recruitment of NF-kappaB to the promoter and conversion of heterochromatin structures present on the latent provirus to active euchromatin structures containing acetylated histones. Surprisingly, latently infected primary cells cannot be induced by tumor necrosis factor alpha because of a restriction in P-TEFb levels, which can be overcome by activation of the TCR. Thus, a combination of restrictive chromatin structures at the HIV long terminal repeat and limiting P-TEFb levels contribute to transcriptional silencing leading to latency in primary CD4(+) T cells.


Figures

FIG. 1.
FIG. 1.
Method for obtaining large populations of latently infected primary CD4+ T cells.
FIG. 2.
FIG. 2.
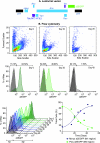
Progressive silencing of HIV expression in infected CD4+ T cells. (A) Structure of lentiviral vectors. In some experiments, mCherry was used in place of the d2EGFP fluorescent reporter depicted in this diagram. (B) Flow cytometric analysis of infected cells placed on H80 feeder cells. The top panels show a light scatter analysis of the cell size. During proviral silencing, the activated T cells become quiescent and become reduced in size, as indicated by reductions in both forward and side light scatter. The middle panels display selected histograms showing the fraction of cells expressing d2EGFP at day 0, day 20, and day 49 after cultivation of sorted cells on the H80 feeder cell line. A gray histogram shows uninfected control cells used to set the gates indicated by the bars. The percentage of cells in each gate for the various silenced cell populations is given above the bars. The bottom panels show the time course of proviral silencing during cultivation of CD4+ T cells on H80 feeder cells. Histograms are shown on the left. The graph on the right shows the percent d2EGFP+ cells (green line; >2 × 10°) and the percent d2EGFP cells (black line; >2 × 10°) for each time point (C).
FIG. 3.
FIG. 3.
Epigenetic silencing of HIV expression CD4+ T cells obtained from PBMC and tonsil tissue. (A) Silencing and reactivation in CD4+ T cells from PBMC. (Left panel) CD4+ T cells isolated from PBMC were infected with viruses carrying wild-type Tat and the d2EGFP reporter. After sorting for d2EGFP+ cells the population was cultivated on H80 feeder cells for up to 63 days. (Right panel) At day 63, the latently cells were reactivated by stimulation of the TCR with α-CD3/CD28 antibodies. During the next 5 days there was a gradual reactivation of the entire latently infected cell population. (B) Silencing in CD4+ T cells from tonsils. CD4+ T cells were isolated from discard tonsils and infected with viruses carrying either H13L Tat (left) or wild-type Tat (right) and the mCherry reporter. After sorting for mCherry+ cells, the populations were cultivated on H80 feeder cells for the next 30 days. During this period there was progressive silencing of the proviruses.
FIG. 4.
FIG. 4.
Latently infected cells are central resting memory cells. Flow cytometric analysis of CD4+ PBMC and quiescent CD4+ T cells was performed. (A) CD45RA versus CD45RO. Note that the PBMC population contains a mixture of CD45RA+ CD45RO naive T cells and CD45RA CD45RO+ memory T cells. (B) CD25 versus CD45RO. (C) CD38 versus CD45RO. (D) CCR7 versus CD45RO. (E) CD27 versus CD45RO.
FIG. 5.
FIG. 5.
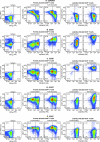
Changes in surface marker expression during the activation of cells latently infected with viruses carrying H13L Tat. Primary CD4+ cells harboring latent provirus which had been maintained on the H80 feeder cells were analyzed by multicolor flow cytometry before and after activation for 18 h with α-CD3/CD28 antibodies. (A) d2EGFP (GFP) versus CD38 (PerCP-Cy5). (B) CD45RA (APC) versus CD38 (PerCP-Cy5). (C) CD25 (PE) versus CD38 (PerCP-Cy5). (D) CD27 (APC-Cy7) versus CD38 (PerCP-Cy5). (E) CCR7 (PE-Cy7) versus CD38 (PerCP-Cy5) (F) CD4 (Pacific Blue) versus CD38 (PerCP-Cy5). Note that CD4 is downregulated while d2EGFP, CD25, and CCR7 are upregulated after proviral activation.
FIG. 6.
FIG. 6.
Changes in surface marker expression during the activation of cells latently infected with viruses carrying wild-type Tat. Primary CD4+ cells infected with viruses carrying wild-type Tat were allowed to enter latency by cultivation on H80 feeder cells for over 60 days. Cells harboring latent provirus were analyzed by multicolor flow cytometry before and after activation for 16 h with α-CD3/CD28 antibodies. (A) d2EGFP (GFP) versus CD45RO (PE). (B) CD45RA (APC) versus CD45RO (PE). (C) CD25 (Perp-Cy5) versus CD45RO (PE). (D) CD27 (APC-Cy7) versus CD45RO (PE). (E) CCR7 (PE-Cy7) versus CD45RO (PE). (F) CD4 (Pacific Blue) versus CD45RO (PE). Note that the latently infected cells constitutively express CD45RO, CD38, and CD27. The cells used in this experiment were from a different donor than the cells used in the experiment in Fig. 5.
FIG. 7.
FIG. 7.
CD4+ cells show restricted DNA synthesis after cultivation on H80 feeder cell lines. (A) The proliferation capability of freshly isolated CD4+ T cells from PBMC and mock-infected cells that had been cultivated on the H80 feeder cell line for more than 60 days was analyzed by measuring BrdU nucleotide incorporation into cellular DNA (FITC) before and after activating them with α-CD3/CD28 antibodies. Labeling with BrdU was done for 18 h. The data are displayed against a second cell activation marker, CD25 (APC-Cy7). (B) Ki67 (PE) expression after activation of quiescent T cells. (C) CCR7 expression after activation of the quiescent T cells.
FIG. 8.
FIG. 8.
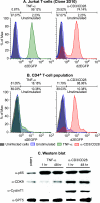
Latently infected primary CD4+ T cells have restricted nuclear P-TEFb levels. (A) Latently infected Jurkat T cells (clone 2D10 [40]) were stimulated for 18 h by TNF-α (left) or by α-CD3/CD28 antibodies (right) and analyzed for d2EGFP expression by flow cytometry. The gray histogram shows uninfected control cells used to set the gates, indicated by the bars above the histograms. The percentage of cells in each gate for the activated cell population is given above the bars, and the percentage of cells in each gate for the control unstimulated cell population is given below the bar. (B) CD4+ T cells from PBMC were infected with pHR-p-d2EGFP vector carrying H13L Tat and allowed to enter latency by culturing on H80 feeder cells. The latently infected cell population was then stimulated for 18 h by TNF-α (left) or by α-CD3/CD28 antibodies (right) and analyzed for d2EGFP expression by flow cytometry. The gray histogram shows uninfected control cells used to set the gates, indicated by the bars above the histograms. The percentage of cells in each gate for the activated cell population is given above the bars, and the percentage of cells in each gate for the control unstimulated cell population is given below the bar. (C) Western blotting was performed on nuclear extracts obtained from latently infected cells before and after activating them with either TNF-α or with antibodies against TCR. Antibodies used were: α-NFκB p65, α-CDK9, α-CyclinT1 (CycT1), and α-SPT5. Note that NF-κB p65 is efficiently induced by the both TNF-α and TCR stimulation. In contrast, P-TEFb levels (CDK-9, CycT1) in the nucleus are strongly stimulated by TCR activation but not by TNF-α treatment.
FIG. 9.
FIG. 9.
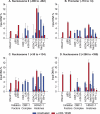
Fluctuations in the levels of different transcription and chromatin-associated factors, before and after activation of latently infected primary CD4+ T cells with α-CD3/CD28 antibodies. ChIP analysis was performed on primary cells latently infected with proviruses carrying H13L Tat and the d2EGFP marker. Antibodies used for the analysis included RNAP II (N20), transcription initiation factors (p65 and p300), CBF-1 repressor complex (CBF-1, CIR, and Sin3A), and histones and chromatin-modifying proteins (HDAC-1, acetylated histone H3, trimethyl-lysine-9-histone H3, trimethyl-lysine-27-histone H3, and HP-1α). (A) Primers directed to the nucleosome 0 region (−396 to −282). (B) Promoter region (−116 to +4). (C) Nucleosome 1 (+30 to +134). (D) Nucleosome 2 (+286 to +390). Blue bars, latently infected cells; red bars, cells after 30 min of treatment with α-CD3/CD28 antibodies.

Similar articles

Cited by

  • Targeting Epigenetics to Cure HIV-1: Lessons From (and for) Cancer Treatment.
    Svensson JP. Svensson JP. Front Cell Infect Microbiol. 2021 May 7;11:668637. doi: 10.3389/fcimb.2021.668637. eCollection 2021. Front Cell Infect Microbiol. 2021. PMID: 34026665 Free PMC article. Review.
  • Targeted Chromatinization and Repression of HIV-1 Provirus Transcription with Repurposed CRISPR/Cas9.
    Olson A, Basukala B, Lee S, Gagne M, Wong WW, Henderson AJ. Olson A, et al. Viruses. 2020 Oct 12;12(10):1154. doi: 10.3390/v12101154. Viruses. 2020. PMID: 33053801 Free PMC article.
  • The immunological synapse: the gateway to the HIV reservoir.
    Kulpa DA, Brehm JH, Fromentin R, Cooper A, Cooper C, Ahlers J, Chomont N, Sékaly RP. Kulpa DA, et al. Immunol Rev. 2013 Jul;254(1):305-25. doi: 10.1111/imr.12080. Immunol Rev. 2013. PMID: 23772628 Free PMC article. Review.
  • Targeting HIV latency: pharmacologic strategies toward eradication.
    Xing S, Siliciano RF. Xing S, et al. Drug Discov Today. 2013 Jun;18(11-12):541-51. doi: 10.1016/j.drudis.2012.12.008. Epub 2012 Dec 25. Drug Discov Today. 2013. PMID: 23270785 Free PMC article. Review.
  • Towards an HIV cure: a global scientific strategy.
    International AIDS Society Scientific Working Group on HIV Cure; Deeks SG, Autran B, Berkhout B, Benkirane M, Cairns S, Chomont N, Chun TW, Churchill M, Di Mascio M, Katlama C, Lafeuillade A, Landay A, Lederman M, Lewin SR, Maldarelli F, Margolis D, Markowitz M, Martinez-Picado J, Mullins JI, Mellors J, Moreno S, O'Doherty U, Palmer S, Penicaud MC, Peterlin M, Poli G, Routy JP, Rouzioux C, Silvestri G, Stevenson M, Telenti A, Van Lint C, Verdin E, Woolfrey A, Zaia J, Barré-Sinoussi F. International AIDS Society Scientific Working Group on HIV Cure, et al. Nat Rev Immunol. 2012 Jul 20;12(8):607-14. doi: 10.1038/nri3262. Nat Rev Immunol. 2012. PMID: 22814509 Free PMC article. Review.

References

    1. Biglione, S., S. A. Byers, J. P. Price, V. T. Nguyen, O. Bensaude, D. H. Price, and W. Maury. 2007. Inhibition of HIV-1 replication by P-TEFb inhibitors DRB, seliciclib, and flavopiridol correlates with release of free P-TEFb from the large, inactive form of the complex. Retrovirology 4:47. - PMC - PubMed
    1. Brenchley, J. M., B. J. Hill, D. R. Ambrozak, D. A. Price, F. J. Guenaga, J. P. Casazza, J. Kuruppu, J. Yazdani, S. A. Migueles, M. Connors, M. Roederer, D. C. Douek, and R. A. Koup. 2004. T-cell subsets that harbor human immunodeficiency virus (HIV) in vivo: implications for HIV pathogenesis. J. Virol. 78:1160-1168. - PMC - PubMed
    1. Brooks, D. G., P. A. Arlen, L. Gao, C. M. Kitchen, and J. A. Zack. 2003. Identification of T cell-signaling pathways that stimulate latent HIV in primary cells. Proc. Natl. Acad. Sci. U. S. A. 100:12955-12960. - PMC - PubMed
    1. Brooks, D. G., S. G. Kitchen, C. M. Kitchen, D. D. Scripture-Adams, and J. A. Zack. 2001. Generation of HIV latency during thymopoiesis. Nat. Med. 7:459-464. - PubMed
    1. Burke, B., H. J. Brown, M. D. Marsden, G. Bristol, D. N. Vatakis, and J. A. Zack. 2007. Primary cell model for activation-inducible human immunodeficiency virus. J. Virol. 81:7424-7434. - PMC - PubMed

Publication types

MeSH terms