. 2010 May 18;17(5):510-22.
doi: 10.1016/j.ccr.2010.03.017. Epub 2010 Apr 15.

Identification of a CpG island methylator phenotype that defines a distinct subgroup of glioma

Affiliations

Identification of a CpG island methylator phenotype that defines a distinct subgroup of glioma

Houtan Noushmehr et al. Cancer Cell. .

Abstract

We have profiled promoter DNA methylation alterations in 272 glioblastoma tumors in the context of The Cancer Genome Atlas (TCGA). We found that a distinct subset of samples displays concerted hypermethylation at a large number of loci, indicating the existence of a glioma-CpG island methylator phenotype (G-CIMP). We validated G-CIMP in a set of non-TCGA glioblastomas and low-grade gliomas. G-CIMP tumors belong to the proneural subgroup, are more prevalent among lower-grade gliomas, display distinct copy-number alterations, and are tightly associated with IDH1 somatic mutations. Patients with G-CIMP tumors are younger at the time of diagnosis and experience significantly improved outcome. These findings identify G-CIMP as a distinct subset of human gliomas on molecular and clinical grounds.


Conflict of interest statement

Conflict of interest statement

P.W.L. is a shareholder, consultant and scientific advisory board member of Epigenomics, AG, which has a commercial interest in DNA methylation markers. This work was not supported by Epigenomics, AG. K.A. is a consultant and scientific advisory board member for Castle Biosciences, which has a commercial interest in molecular diagnostics. This work was not supported by Castle Biosciences.

Figures

Figure 1
Figure 1. Clustering of TCGA GBM tumors and control samples identifies a CpG Island Methylator Phenotype (G-CIMP)
Unsupervised consensus clustering was performed using the 1,503 Infnium DNA methylation probes whose DNA methylation beta values varied the most across the 91 TCGA GBM samples. DNA Methylation clusters are distinguished with a color code at the top of the panel: red, consensus cluster 1 (n=12 tumors); blue, consensus cluster 2 (n=31 tumors); green, consensus cluster 3 (n=48 samples). Each sample within each DNA Methylation cluster are colored labeled as described in the key for its gene expression cluster membership (Proneural, Neural, Classical and Mesenchymal). The somatic mutation status of five genes (EGFR, IDH1, NF1, PTEN, and TP53) are indicated by the black squares, the gray squares indicate the absence of mutations in the sample and the white squares indicate that the gene was not screened in the specific sample. G-CIMP-positive samples are labeled at the bottom of the matrix. A) Consensus matrix produced by k-means clustering (K = 3). The samples are listed in the same order on the x and y axes. Consensus index values range from 0 to 1, 0 being highly dissimilar and 1 being highly similar. B) One-dimensional hierarchical clustering of the same 1,503 most variant probes, with retention of the same sample order as in Figure 1A. Each row represents a probe; each column represents a sample. The level of DNA methylation (beta value) for each probe, in each sample, is represented by using a color scale as shown in the legend; white indicates missing data. M.SssI-treated DNA (n=2), WGA-DNA (n=2) and normal brain (n=4) samples are included in the heatmap but did not contribute to the unsupervised clustering. The probes in the eight control samples are listed in the same order as the y axis of the GBM sample heatmap. See also Figure S1 and Table S1.
Figure 2
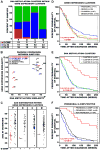
Figure 2. Characterization of G-CIMP tumors as a unique subtype of GBMs within the proneural gene expression subgroup
A) Integration of the samples within each DNA methylation and gene expression cluster. Samples are primarily categorized by their gene expression subtype: P, proneural; N, neural; C, classical; M, mesenchymal. The number and percent of tumors within each DNA methylation cluster (red, cluster 1 (G-CIMP); blue, cluster 2; green, cluster 3) are indicated for each gene expression subtype. B) Scatter plot of pairwise comparison of the gene expression and DNA methylation clusters as identified in Figure 1 and Figure S1. Same two-letter represents self-comparison while mixed two-letter represents the pair-wise correlation between gene expression and DNA methylation. Axes are reversed to illustrate increasing similarity. C) GBM patient age distribution at time of diagnosis within each gene expression cluster. Samples are divided by gene expression clusters as identified along the top of each jitter plot, and further subdivided by G-CIMP status within each expression subgroup. G-CIMP-positive samples are indicated as red data points and G-CIMP-negative samples are indicated as black data points. Median age at diagnosis is indicated for each subgroup by a horizontal solid black line. D–F) Kaplan-Meier survival curves for GBM methylation and gene expression subtypes. In each plot, the percent probability of survival is plotted versus time since diagnosis in weeks. All samples with survival data greater than five years were censored. D) Kaplan-Meier survival curves among the four GBM expression subtypes. Proneural tumors are in blue, Neural tumors are in green, Classical tumors are in red, and Mesenchymal tumors are in gold. E) Kaplan-Meier survival curves between the three DNA methylation clusters. Cluster 1 tumors are in red, cluster 2 tumors are in blue and cluster 3 tumors are in green. F) Kaplan-Meier survival curves between proneural G-CIMP-positive, proneural G-CIMP-negative and all non-proneural GBM tumors. Proneural G-CIMP-positive tumors are in red, proneural G-CIMP-negative tumors are in blue and all non-proneural GBM tumors are in black. See also Figure S2.
Figure 3
Figure 3. Significant regions of copy number variation in the G-CIMP genome
Copy number variation for 23,748 loci (across 22 autosomes and plotted in genomic coordinates along the x-axis) was analyzed using 61 proneural TCGA GBM tumors. Homozygous deletion is indicated in dark blue, hemizygous deletion in light blue, neutral/no change in white, gain in light red and high-level amplification in dark red. A) Copy number variation between proneural G-CIMP positive and G-CIMP negative tumors. The Cochran Armitage test for trend, percent total amplification/deletion and raw copy number values are listed. The – log10(FDR-adjusted P value) between G-CIMP-positive and G-CIMP negative proneurals is plotted along the y-axis in the “adjusted P-value pos vs. neg” panel. In this panel, red vertical lines indicate significance. Gene regions in 8q23.1-q24.3 and 10p15.2-11.21 are identified by asterisks and are highlighted in panels B and C, respectively. See also Figure S4 and Table S3.
Figure 4
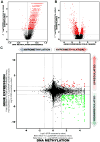
Figure 4. Comparison of transcriptome versus epigenetic differences between proneural G-CIMP-positive and G-CIMP-negative tumors
A) Volcano Plots of all CpG loci analyzed for G-CIMP association. The beta value difference in DNA Methylation between the proneural G-CIMP-positive and proneural G-CIMP-negative tumors is plotted on the x-axis, and the p-value for a FDR-corrected Wilcoxon signed-rank test of differences between the proneural G-CIMP-positive and proneural G-CIMP-negative tumors (−1* log10 scale) is plotted on the y-axis. Probes that are significantly different between the two subtypes are colored in red. B) Volcano plot for all genes analyzed on the Agilent gene expression platform. C) Starburst plot for comparison of TCGA Infinium DNA methylation and Agilent gene expression data normalized by copy number information for 11,984 unique genes. Log10(FDR-adjusted P value) is plotted for DNA methylation (x-axis) and gene expression (y-axis) for each gene. If a mean DNA methylation β-value or mean gene expression value is higher (greater than zero) in G-CIMP-positive tumors, −1 is multiplied to log10(FDR-adjusted P value), providing positive values. The dashed black lines indicates FDR-adjusted P value at 0.05. Data points in red indicate those that are significantly up- and down-regulated in their gene expression levels and significantly hypo- or hypermethylated in proneural G-CIMP-positive tumors. Data points in green indicate genes that are significantly down-regulated in their gene expression levels and hypermethylated in proneural G-CIMP-positive tumors compared to proneural G-CIMP-negative tumors. See also Figure S5 and Table S3.
Figure 5
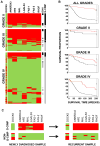
Figure 5. G-CIMP prevalence in grade II, III and IV gliomas using MethyLight
A) Methylation profiling of gliomas shows an association of CIMP status with tumor grade. Eight markers were tested for G-CIMP DNA methylation in 360 tumor samples. Each marker was coded as red if methylated and green if unmethylated. One of these markers (DOCK5) is unmethylated in CIMP, while the remaining seven markers show G-CIMP-specific hypermethylation. G-CIMP-positive status was determined if ≥6 of the 8 genes had G-CIMP-defining hyper- or hypomethylation. G-CIMP-positive status is indicated with a black line (right side of panel), and a grey line indicates non G-CIMP. Samples with an identified IDH1 mutation is indicated as a black line and samples with no known IDH1 mutation as a grey line. White line indicates unknown IDH1 status. B) Association of G-CIMP status with patient outcome stratified by tumor grade. G-CIMP-positive cases are indicated by red lines and the G-CIMP-negative cases are indicated by black lines in each Kaplan-Meier survival curve. C) Stability of G-CIMP over time in glioma patients. Fifteen samples from newly diagnosed tumors were tested for G-CIMP positivity using the eight-marker MethyLight panel. Eight tumors were classified as G-CIMP-positive (upper left panel), and seven tumors were classified as G-CIMP-negative (non-G-CIMP, lower left panel). Samples from a second procedure, ranging from 2–9 years after the initial resection, were also evaluated for the G-CIMP-positive cases (upper right panel), as well as for the non-G-CIMP cases (lower right panel). Each marker was coded as red if methylated and green if unmethylated.

Comment in

  • To infinium, and beyond!
    Wright KD, Gilbertson RJ. Wright KD, et al. Cancer Cell. 2010 May 18;17(5):419-20. doi: 10.1016/j.ccr.2010.04.020. Cancer Cell. 2010. PMID: 20478523

Similar articles

Cited by

References

    1. Adamson C, Kanu OO, Mehta AI, Di C, Lin N, Mattox AK, Bigner DD. Glioblastoma multiforme: a review of where we have been and where we are going. Expert Opin Investig Drugs. 2009;18:1061–1083. - PubMed
    1. Amundadottir LT, Sulem P, Gudmundsson J, Helgason A, Baker A, Agnarsson BA, Sigurdsson A, Benediktsdottir KR, Cazier JB, Sainz J, et al. A common variant associated with prostate cancer in European and African populations. Nat Genet. 2006;38:652–658. - PubMed
    1. Balss J, Meyer J, Mueller W, Korshunov A, Hartmann C, von Deimling A. Analysis of the IDH1 codon 132 mutation in brain tumors. Acta Neuropathol. 2008;116:597–602. - PubMed
    1. Bibikova M, Lin Z, Zhou L, Chudin E, Garcia EW, Wu B, Doucet D, Thomas NJ, Wang Y, Vollmer E, et al. High-throughput DNA methylation profiling using universal bead arrays. Genome Res. 2006;16:383–393. - PMC - PubMed
    1. Bleeker FE, Lamba S, Leenstra S, Troost D, Hulsebos T, Vandertop WP, Frattini M, Molinari F, Knowles M, Cerrato A, et al. IDH1 mutations at residue p.R132 (IDH1(R132)) occur frequently in high-grade gliomas but not in other solid tumors. Hum Mutat. 2009;30:7–11. - PubMed

Publication types

Substances