

Conservation and divergence of methylation patterning in plants and animals
- PMID: 20395551
- PMCID: PMC2889301
- DOI: 10.1073/pnas.1002720107
Conservation and divergence of methylation patterning in plants and animals
Abstract
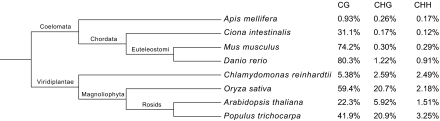
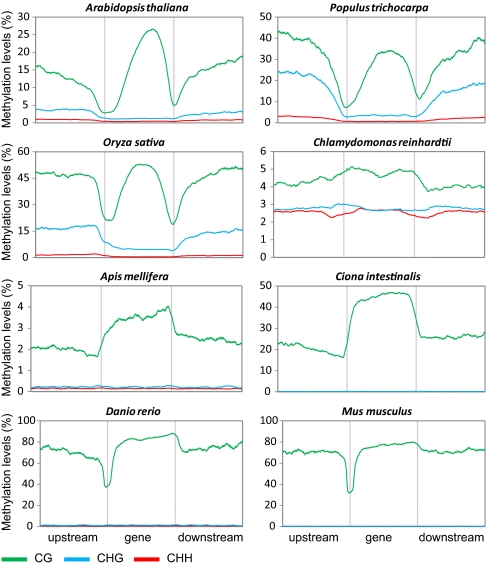
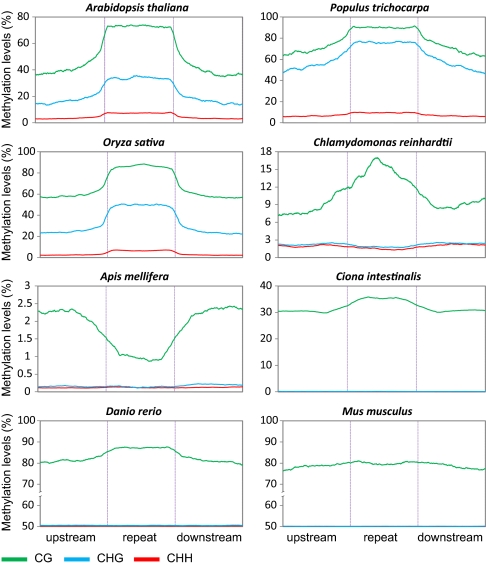
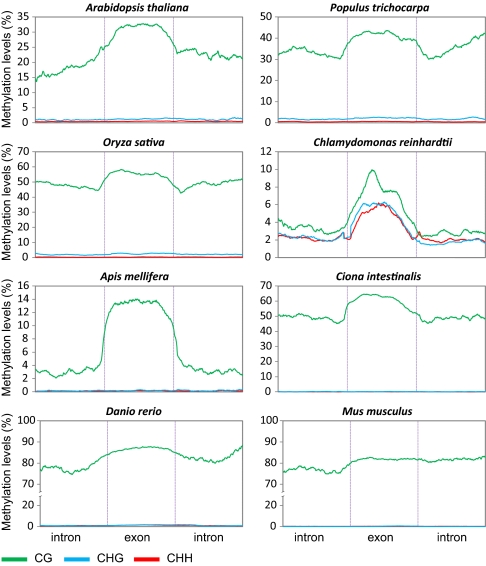
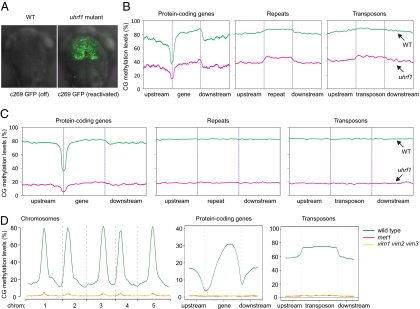
Cytosine DNA methylation is a heritable epigenetic mark present in many eukaryotic organisms. Although DNA methylation likely has a conserved role in gene silencing, the levels and patterns of DNA methylation appear to vary drastically among different organisms. Here we used shotgun genomic bisulfite sequencing (BS-Seq) to compare DNA methylation in eight diverse plant and animal genomes. We found that patterns of methylation are very similar in flowering plants with methylated cytosines detected in all sequence contexts, whereas CG methylation predominates in animals. Vertebrates have methylation throughout the genome except for CpG islands. Gene body methylation is conserved with clear preference for exons in most organisms. Furthermore, genes appear to be the major target of methylation in Ciona and honey bee. Among the eight organisms, the green alga Chlamydomonas has the most unusual pattern of methylation, having non-CG methylation enriched in exons of genes rather than in repeats and transposons. In addition, the Dnmt1 cofactor Uhrf1 has a conserved function in maintaining CG methylation in both transposons and gene bodies in the mouse, Arabidopsis, and zebrafish genomes.
Conflict of interest statement
The authors declare no conflict of interest.
Figures
Similar articles
-
Intronic non-CG DNA hydroxymethylation and alternative mRNA splicing in honey bees.BMC Genomics. 2013 Sep 30;14:666. doi: 10.1186/1471-2164-14-666. BMC Genomics. 2013. PMID: 24079845 Free PMC article.
-
Site-specific methylation in gene coding region underlies transcriptional silencing of the Phytochrome A epiallele in Arabidopsis thaliana.Plant Mol Biol. 2012 May;79(1-2):191-202. doi: 10.1007/s11103-012-9906-1. Epub 2012 Apr 1. Plant Mol Biol. 2012. PMID: 22466452
-
Shotgun bisulphite sequencing of the Arabidopsis genome reveals DNA methylation patterning.Nature. 2008 Mar 13;452(7184):215-9. doi: 10.1038/nature06745. Epub 2008 Feb 17. Nature. 2008. PMID: 18278030 Free PMC article.
-
DNA methylation in plants.Curr Top Microbiol Immunol. 2006;301:67-122. doi: 10.1007/3-540-31390-7_4. Curr Top Microbiol Immunol. 2006. PMID: 16570846 Review.
-
Functions of DNA methylation: islands, start sites, gene bodies and beyond.Nat Rev Genet. 2012 May 29;13(7):484-92. doi: 10.1038/nrg3230. Nat Rev Genet. 2012. PMID: 22641018 Review.
Cited by
-
Triticale doubled haploid plant regeneration factors linked by structural equation modeling.J Appl Genet. 2022 Dec;63(4):677-690. doi: 10.1007/s13353-022-00719-7. Epub 2022 Aug 26. J Appl Genet. 2022. PMID: 36018540 Free PMC article.
-
Novel Insights into Insect-Microbe Interactions-Role of Epigenomics and Small RNAs.Front Plant Sci. 2016 Aug 4;7:1164. doi: 10.3389/fpls.2016.01164. eCollection 2016. Front Plant Sci. 2016. PMID: 27540386 Free PMC article. Review.
-
DNA METHYLTRANSFERASE 1 is involved in (m)CG and (m)CCG DNA methylation and is essential for sporophyte development in Physcomitrella patens.Plant Mol Biol. 2015 Jul;88(4-5):387-400. doi: 10.1007/s11103-015-0328-8. Epub 2015 May 6. Plant Mol Biol. 2015. PMID: 25944663
-
DNA Methylation and Demethylation Are Regulated by Functional DNA Methyltransferases and DnTET Enzymes in Diuraphis noxia.Front Genet. 2020 Jun 23;11:452. doi: 10.3389/fgene.2020.00452. eCollection 2020. Front Genet. 2020. PMID: 32655611 Free PMC article.
-
The Seagrass Methylome Is Associated With Variation in Photosynthetic Performance Among Clonal Shoots.Front Plant Sci. 2020 Sep 4;11:571646. doi: 10.3389/fpls.2020.571646. eCollection 2020. Front Plant Sci. 2020. PMID: 33013993 Free PMC article.
References
-
- Henderson IR, Jacobsen SE. Epigenetic inheritance in plants. Nature. 2007;447:418–424. - PubMed
-
- Chan SW, Henderson IR, Jacobsen SE. Gardening the genome: DNA methylation in Arabidopsis thaliana. Nat Rev Genet. 2005;6:351–360. - PubMed
-
- Goll MG, Bestor TH. Eukaryotic cytosine methyltransferases. Annu Rev Biochem. 2005;74:481–514. - PubMed
-
- Suzuki MM, Bird A. DNA methylation landscapes: Provocative insights from epigenomics. Nat Rev Genet. 2008;9:465–476. - PubMed
Publication types
MeSH terms
Substances
Associated data
- Actions
Grants and funding
LinkOut - more resources
Full Text Sources
Other Literature Sources
Molecular Biology Databases
