. 2010 Apr 15;24(8):783-98.
doi: 10.1101/gad.1897310.

Transcriptional silencing of {gamma}-globin by BCL11A involves long-range interactions and cooperation with SOX6

Affiliations

Transcriptional silencing of {gamma}-globin by BCL11A involves long-range interactions and cooperation with SOX6

Jian Xu et al. Genes Dev. .

Abstract

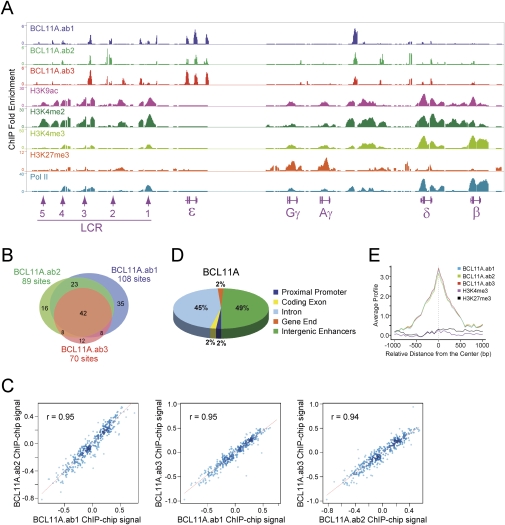
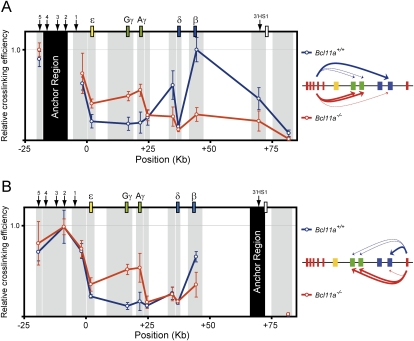
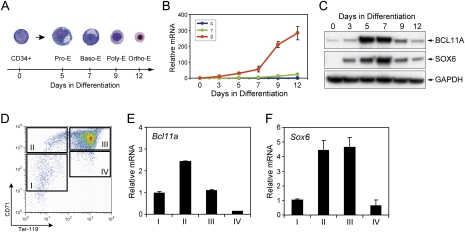
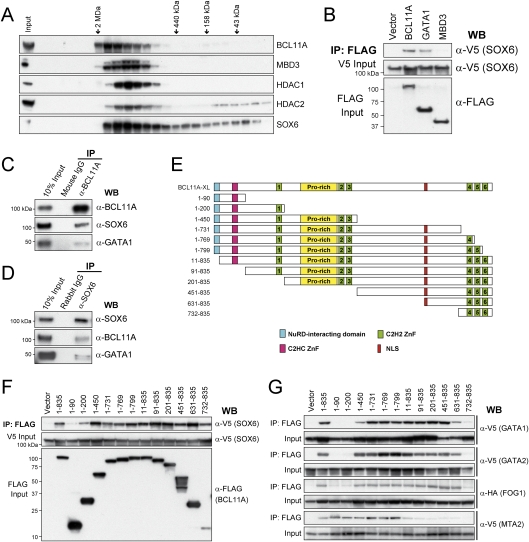
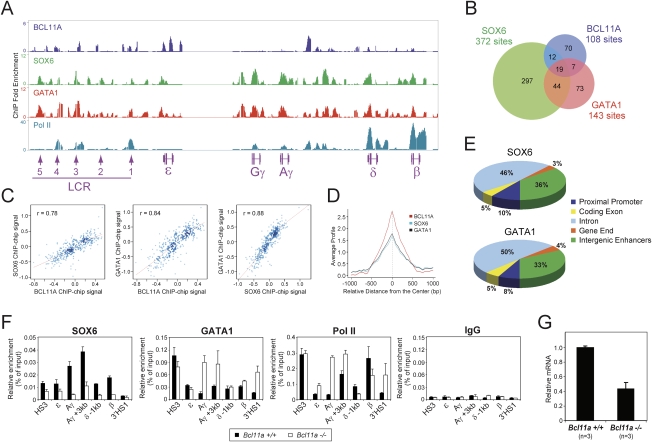
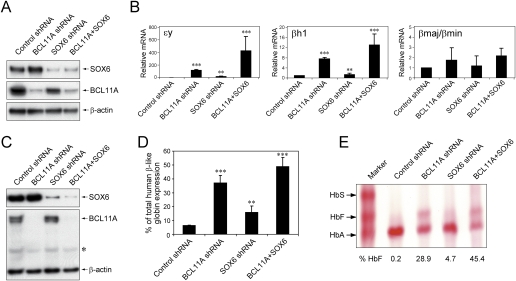
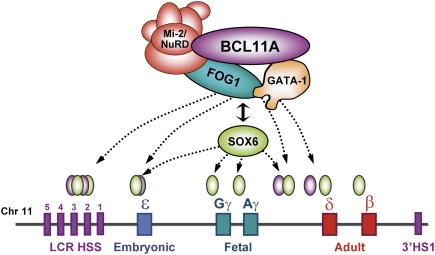
The developmental switch from human fetal (gamma) to adult (beta) hemoglobin represents a clinically important example of developmental gene regulation. The transcription factor BCL11A is a central mediator of gamma-globin silencing and hemoglobin switching. Here we determine chromatin occupancy of BCL11A at the human beta-globin locus and other genomic regions in vivo by high-resolution chromatin immunoprecipitation (ChIP)-chip analysis. BCL11A binds the upstream locus control region (LCR), epsilon-globin, and the intergenic regions between gamma-globin and delta-globin genes. A chromosome conformation capture (3C) assay shows that BCL11A reconfigures the beta-globin cluster by modulating chromosomal loop formation. We also show that BCL11A and the HMG-box-containing transcription factor SOX6 interact physically and functionally during erythroid maturation. BCL11A and SOX6 co-occupy the human beta-globin cluster along with GATA1, and cooperate in silencing gamma-globin transcription in adult human erythroid progenitors. These findings collectively demonstrate that transcriptional silencing of gamma-globin genes by BCL11A involves long-range interactions and cooperation with SOX6. Our findings provide insight into the mechanism of BCL11A action and new clues for the developmental gene regulatory programs that function at the beta-globin locus.


Figures

Figure 1.
Figure 1.
Chromatin occupancy of BCL11A and common histone modifications within the human β-globin locus. (A) Genome browser representation of BCL11A.ab1, BCL11A.ab2, BCL11A.ab3, H3K9ac, H3K4me2, H3K4me3, H3K27me3, and RNA Pol II-binding patterns at the human β-globin cluster in primary adult human erythroid progenitors. The human β-globin locus is depicted at the bottom containing five β-like globin genes (ɛ, Gγ, Aγ, δ, and β) and the upstream DNase I HSs (1–5) within the LCR. (B) Venn diagram of genome-wide colocalization of BCL11A.ab1, BCL11A.ab2, and BCL11A.ab3 ChIP–chip sites. (C) Genome-wide analysis of BCL11A.ab1, BCL11A.ab2, BCL11A.ab3 co-occupancy. Scatter plots displays mutual enrichment between indicated ChIP–chip data sets relative to the input. Correlation values are shown. (D) Distribution of BCL11A enrichment peaks located in the promoter (−3 kb to +1 kb), coding exon, intron, gene end (5′UTR and 3′UTR), or intergenic enhancers (outside of these defined regions). The values were calculated using data sets combining BCL11A.ab1, BCL11A.ab2, and BCL11A.ab3. (E) Sitepro (Shin et al. 2009) analysis of the genome-wide correlation between the indicated ChIP–chip data sets. The average signal (from a WIG) is shown for the 2-kb region surrounding the center of the ChIP–chip sites from the BCL11A.ab1 data set.
Figure 2.
Figure 2.
BCL11A reconfigures the human β-globin cluster. Locus-wide cross-linking frequencies show reconfiguration of the human β-globin cluster in the absence of Bcl11a. Relative cross-linking frequencies observed in wild-type (Bcl11a+/+) E14.5 fetal liver erythroid cells are shown in blue, and Bcl11a−/− cells are shown in red. Gray shading indicates position and size of the analyzed fragments, and black shading represents the “anchor region” HS2–HS4 (A) and 3′HS1 (B). Spatial organization of the human β-globin locus is indicated at the top. Schematic diagrams representing the three-dimensional interactions that occur within the human β-globin cluster are shown at the side. In each graph, the highest cross-linking frequency value was set to 1. The X-axis shows position (in kilobases) in the locus. All data are plotted as the mean ± SD of the measurement.
Figure 3.
Figure 3.
BCL11A and SOX6 are coexpressed during erythroid development. (A) Human CD34+ cells were induced for erythroid differentiation in a serum-free two-phase liquid culture model. Representative cytospin images were shown for undifferentiated CD34+ cells, proerythroblasts (Pro-E), basophilic erythroblasts (Baso-E), polychromatic erythroblasts (Poly-E), and orthrochromatic erythroblasts (Ortho-E). (B) Globin mRNA levels were monitored by real-time RT–PCR in erythroid cells at various differentiation stages. All transcript levels were normalized against human GAPDH transcript levels. (C) The expression of human BCL11A and SOX6 proteins was measured by Western blot. GAPDH was analyzed as a loading control. (D) The CD71 and Ter119 expression pattern is shown for mouse fetal liver cells from E14.5 embryos. The cells were FACS-sorted into four populations (I, II, III, and IV) as described previously (Zhang et al. 2003). (E,F) Mouse Bcl11a and Sox6 mRNA levels were measured by real-time RT–PCR. Transcript levels were normalized against mouse Gapd transcript levels. All results are means ± SD of at least three independent experiments.
Figure 4.
Figure 4.
Physical interaction between BCL11A and SOX6. (A) Gel filtration fractions of nuclear extracts from human erythroid progenitors (day 5 in differentiation medium) were blotted for BCL11A, MBD3, HDAC1, HDAC2, and SOX6. There is significant overlap between BCL11A, SOX6, and components of the Mi-2/NuRD complexes. Elution positions of molecular mass standards (from left to right, 2 MDa, 440 kDa, 158 kDa, and 43 kDa) are indicated. (B) V5-tagged SOX6 cDNA was coexpressed in COS7 cells with a Flag-tagged empty vector, BCL11A, GATA1, and MBD3 cDNA. Nuclear extracts were immunoprecipitated using anti-Flag antibody, and copurified proteins were analyzed by Western blot with anti-V5 antibody. Inputs (5%) are shown. (C) Endogenous SOX6 and GATA1 were coimmunoprecipitated with BCL11A in human erythroid cells. Nuclear extracts from erythroid progenitors (day 5 in differentiation medium) were immunoprecipitated with anti-BCL11A (14B5) antibody or mouse IgG (negative control), and copurified proteins were analyzed by Western blot with antibodies against BCL11A, SOX6, and GATA1. (D) Endogenous BCL11A was coimmunoprecipitated with SOX6 in human erythroid cells. Nuclear extracts from human erythroid progenitors were immunoprecipitated with anti-SOX6 antibody or rabbit IgG (negative control). (E) Schematic diagram of BCL11A constructs used in F and G. (F) Co-IP of V5-tagged SOX6 coexpressed transiently with a Flag-tagged vector, BCL11A-XL (1–835 amino acids), or BCL11A truncation mutants in COS7 cells. Nuclear extracts were immunoprecipitated with an anti-Flag antibody, and copurified proteins were analyzed by Western blot with an anti-V5 antibody. Inputs (10%) are shown. (G) Co-IP of V5-tagged GATA1, GATA2, MTA2, or HA-tagged FOG1 coexpressed transiently with a Flag-tagged Vector, BCL11A-XL (1–835 amino acids), or BCL11A truncation mutants in COS7 cells. Co-IP and Western blot were performed as described in F. Inputs (10%) are shown.
Figure 5.
Figure 5.
Chromatin occupancy of BCL11A, SOX6, and GATA1 within the human β-globin locus in adult human erythroid progenitors. (A) In vivo chromatin occupancy of BCL11A, SOX6, GATA1, and RNA Pol II was examined by ChIP–chip in human erythroid progenitors. Precipitated DNA samples were amplified and hybridized to human ENCODE 2.0R array. A genome browser representation of binding patterns at the human β-globin cluster is shown. Relative positions of the human β-like globin genes and the upstream LCR consisting of five DNase I HSs (1–5) are shown at the bottom. (B) A Venn diagram of genome-wide colocalization of BCL11A, SOX6, and GATA1 ChIP–chip sites is shown. (C) Genome-wide analysis of BCL11A, SOX6, and GATA1 cooccupancy is shown. Scatter plots display mutual enrichment between indicated ChIP–chip data sets relative to the input. Correlation values are shown. (D) Sitepro (Shin et al. 2009) analysis of genome-wide correlation between the indicated ChIP–chip data sets. The average signal (from a WIG) is shown for a 2-kb region surrounding the center of ChIP–chip sites from the BCL11A.ab1 data set. (E) Distribution of SOX6 and GATA1 enrichment peaks located in the promoter (−3 kb to +1 kb), coding exon, intron, gene end (5′UTR and 3′UTR), or intergenic enhancers (outside of these defined regions) is shown. (F) In vivo chromatin occupancy of SOX6, GATA1, and RNA Pol II was examined by ChIP in E14.5 fetal liver cells from β-YAC control mice (Bcl11a+/+) and Bcl11a-null mice (Bcl11a−/−). Precipitated DNA samples were quantified using primers designed to amplify several control regions within the human β-globin locus as indicated below each graph. The ChIP signals are shown as a percentage of the input DNA signal. Results are mean ± SD of three independent experiments. (G) Relative mRNA expression of SOX6 was examined by real-time RT–PCR in FACS-sorted Ter119+CD71+ E14.5 fetal liver erythroid cells from Bcl11a+/+ (wild-type, n = 3) and Bcl11a−/− (n = 3) embryos. Transcript levels were normalized against mouse Gapd transcript levels. Results are means ± SD.
Figure 6.
Figure 6.
BCL11A cooperates with SOX6 in silencing γ-globin gene expression. (A) Lentivirus-mediated shRNA delivery to MEL cells results in robust knockdown of both BCL11A and SOX6 proteins. Control samples were transduced with lentivirus prepared from the shRNA empty vector. Cells were harvested 4 d after transduction and analyzed by Western blot using antibodies for SOX6 and BCL11A. β-Actin was analyzed as a loading control. (B) shRNA-mediated knockdown of BCL11A and SOX6 results in elevations of ɛy-globin and βh1-globin mRNA levels. P < 0.001 (***) and P < 0.01 (**) in comparison with controls. (C) Lentiviral shRNA in human erythroid progenitors results in robust knockdown of both BCL11A and SOX6 proteins. Control samples were transduced with lentivirus prepared from the empty vector. Cells were harvested 7 d after transduction, which usually corresponded to day 5 in differentiation medium. Whole-cell lysates were prepared and analyzed by Western blot using antibodies for SOX6 and BCL11A. β-Actin was analyzed as a loading control. An asterisk (*) indicates nonspecific bands. (D) shRNA-mediated knockdown of BCL11A and SOX6 results in elevations of γ-globin mRNA levels (as a percentage of total β-like globin gene expression) on day 5 of differentiation. P < 0.001 (***) and P < 0.01 (**) in comparison with controls. (E) Hemolysates prepared from cells on day 14 of differentiation (terminal stage erythroblasts) show the presence of mature HbF. This was assessed using cellulose acetate hemoglobin electrophoresis with a size marker indicating the positions of HbA and HbF. The percentages indicating the proportion of hemoglobin species were determined by measurement from densitometry. All results are means ± SD from three independent experiments. Statistical significance was calculated using a Student t-test.
Figure 7.
Figure 7.
Model of BCL11A-mediated silencing of γ-globin genes. The diagram illustrates the physical interaction between BCL11A and the Mi-2/NuRD complexes, erythroid transcription factors GATA1 and FOG1, and the HMG-box protein SOX6. Rather than binding to the promoters of the γ-globin or β-globin genes as these latter factors do, BCL11A protein occupies the upstream LCR and γδ-intergenic regions of the β-globin cluster in adult human erythroid progenitors. Our study suggests that transcriptional silencing of γ-globin expression by BCL11A involves long-range interaction within the β-globin cluster and local interactions with the chromatin-associated SOX6 proteins at the proximal promoters of the γ-globin genes.

Similar articles

Cited by

References

    1. Bagga R, Michalowski S, Sabnis R, Griffith JD, Emerson BM 2000. HMG I/Y regulates long-range enhancer-dependent transcription on DNA and chromatin by changes in DNA topology. Nucleic Acids Res 28: 2541–2550 - PMC - PubMed
    1. Bank A 2006. Regulation of human fetal hemoglobin: New players, new complexities. Blood 107: 435–443 - PMC - PubMed
    1. Bender MA, Bulger M, Close J, Groudine M 2000. β-Globin gene switching and DNase I sensitivity of the endogenous β-globin locus in mice do not require the locus control region. Mol Cell 5: 387–393 - PubMed
    1. Cantor AB, Orkin SH 2005. Coregulation of GATA factors by the Friend of GATA (FOG) family of multitype zinc finger proteins. Semin Cell Dev Biol 16: 117–128 - PubMed
    1. Cheng Y, Wu W, Kumar SA, Yu D, Deng W, Tripic T, King DC, Chen KB, Zhang Y, Drautz D, et al. 2009. Erythroid GATA1 function revealed by genome-wide analysis of transcription factor occupancy, histone modifications, and mRNA expression. Genome Res 19: 2172–2184 - PMC - PubMed

Publication types

LinkOut - more resources