. 2010 Jun 15;21(12):2013-23.
doi: 10.1091/mbc.e10-02-0083. Epub 2010 Apr 14.

Regulation of microtubule dynamics by Bim1 and Bik1, the budding yeast members of the EB1 and CLIP-170 families of plus-end tracking proteins

Affiliations

Regulation of microtubule dynamics by Bim1 and Bik1, the budding yeast members of the EB1 and CLIP-170 families of plus-end tracking proteins

Kristina A Blake-Hodek et al. Mol Biol Cell. .

Abstract

Microtubule dynamics are regulated by plus-end tracking proteins (+TIPs), which bind microtubule ends and influence their polymerization properties. In addition to binding microtubules, most +TIPs physically associate with other +TIPs, creating a complex web of interactions. To fully understand how +TIPs regulate microtubule dynamics, it is essential to know the intrinsic biochemical activities of each +TIP and how +TIP interactions affect these activities. Here, we describe the activities of Bim1 and Bik1, two +TIP proteins from budding yeast and members of the EB1 and CLIP-170 families, respectively. We find that purified Bim1 and Bik1 form homodimers that interact with each other to form a tetramer. Bim1 binds along the microtubule lattice but with highest affinity for the microtubule end; however, Bik1 requires Bim1 for localization to the microtubule lattice and end. In vitro microtubule polymerization assays show that Bim1 promotes microtubule assembly, primarily by decreasing the frequency of catastrophes. In contrast, Bik1 inhibits microtubule assembly by slowing growth and, consequently, promoting catastrophes. Interestingly, the Bim1-Bik1 complex affects microtubule dynamics in much the same way as Bim1 alone. These studies reveal new activities for EB1 and CLIP-170 family members and demonstrate how interactions between two +TIP proteins influence their activities.


Figures
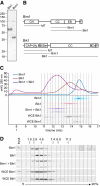
Figure 1.
Figure 1.
Bik1 and Bim1 form homodimers that associate to form a tetrameric complex. (A) Coomassie-stained SDS-PAGE gels of ∼5 μg of Bik1 (left lane) and Bim1 (right lane) purified from insect cells. (B) Diagram of Bim1 (top) and Bik1 (bottom) protein domains. Lines below each protein indicate regions mediating microtubule binding, self-interactions, and Bim1-Bik1 interactions in vivo (Miller et al., 2006; Wolyniak et al., 2006; Akhmanova and Steinmetz, 2008). B/Ser, basic, serine-rich region; CH, calponin homology; CC, coiled-coil; CAP-Gly, cytoskeletal-associated protein-glycine–rich; EB, EB1 family homology domain; F, acidic-aromatic motif; Zn, zinc knuckle. (C) Size-exclusion chromatography of purified proteins and yeast whole cell extract (WCE). Chromatograms of purified Bim1 (blue), Bik1 (red), and an equimolar mixture of Bim1 and Bik1 (purple) are shown at top. SDS-PAGE of fractions is shown at bottom. Purified proteins were visualized by Coomassie staining; Bik1 and Bim1 in whole cell extracts were visualized by Western blots using anti-Bim1 or anti-Bik1 antibodies. Arrow indicates the column void volume. (D) Sucrose-gradient sedimentation of purified proteins and yeast whole cell extracts. Fractions from a 5–20% sucrose gradient were analyzed by SDS-PAGE. Purified proteins were visualized by Coomassie staining; Bik1 and Bim1 in whole cell extracts were visualized by Western blots using anti-Bim1 or anti-Bik1 antibodies. Arrows indicate the positions of markers with known S values in the gradient.
Figure 2.
Figure 2.
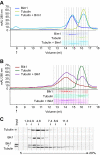
Analysis of Bim1 and Bik1 binding to tubulin heterodimers. Size-exclusion chromatography of (A) Bim1 (blue), tubulin (green), and an equimolar mixture of Bim1 and tubulin (turquoise), and (B) Bik1 (red), tubulin (green), and an equimolar mixture of Bik1 and tubulin (purple). Chromatograms are shown at top and SDS-PAGE of fractions (Coomassie-stained) are shown at bottom. Arrows indicates the column void volumes. (C) Sucrose-gradient sedimentation of Bik1, tubulin, and an equimolar mixture of Bik1 and tubulin. Fractions from a 5–20% sucrose gradient were analyzed by SDS-PAGE, and proteins were visualized by Coomassie staining. Arrows indicate the positions of markers with known S values in the gradient.
Figure 3.
Figure 3.
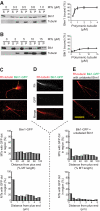
Microtubule binding and plus-end localization of Bim1 and Bik1. (A) Bim1 at 40 nM was incubated with various concentrations of taxol-stabilized microtubules. Left, microtubules were pelleted by centrifugation, and the pellet fraction (P) and the supernatant fraction (S) were analyzed by SDS-PAGE and Western blotting using Bim1 and α-tubulin antibodies. Right, band intensities were quantified using ImageJ, and the percentage of Bim1 bound was calculated. Error bars, ±SD. (B) Analysis of Bik1 binding to microtubules was done as described in A, except that higher microtubule concentrations were used. Bik1 was visualized using Bik1 antibody. (C–E) Localization of GFP-labeled proteins on microtubules. (C) Bim1-GFP, (D) Bik1-GFP, or (E) Bik1-GFP and unlabeled Bim1 were incubated with microtubules assembled from sea urchin axonemes in the presence of rhodamine-labeled tubulin. Microtubules are shown in red and GFP-labeled proteins in green. The positions of the Bim1-GFP (C) or Bik1-GFP (E) dots were graphed in two ways: their relative location along the microtubule (top graph) and their absolute distance from the plus end (bottom graph). Bar, 10 μm.
Figure 4.
Figure 4.
Bim1 promotes and Bik1 inhibits microtubule assembly in vitro. (A) Sea urchin axonemes were incubated with 11.5 μM tubulin alone (left) and in the presence of 1 μM Bim1 (center) or 1 μM Bik1 (right). Microtubules were visualized using VE-DIC microscopy. Axonemes are the larger rod-shaped structures indicated by the arrowheads in the left panel. Microtubules nucleated from the plus end or minus end of the axoneme are indicated by (+) and (−) symbols, respectively. Scale bar, 5 μM. (B) To quantify the effects of Bim1 (left) and Bik1 (right) on microtubule assembly, the total microtubule length per axoneme was calculated by multiplying the average length of microtubules by the average number of microtubules per axoneme. Error bars, ±SD.
Figure 5.
Figure 5.
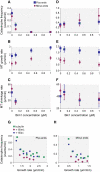
Effects of Bim1 and Bik1 on microtubule dynamics. (A–F) Sea urchin axonemes were incubated with 11.5 μM tubulin in the presence of varying concentrations of Bim1 or Bik1. Individual microtubules were visualized using VE-DIC microscopy and their lengths measured over time. From this data, we calculated microtubule growth and shrinkage rates, and catastrophe frequencies; rescues were rare (see Supplementary Tables 1 and 2). Plots show the effects of increasing concentrations of Bim1 (A–C) or Bik1 (D–F) on these parameters. Error bars, ±SD. (G and H) Catastrophe frequencies were plotted with respect to microtubule growth rates for microtubule plus ends (G) and minus ends (H). See Materials and Methods for details. Green, tubulin alone; purple, Bim1 plus tubulin; blue, Bik1 plus tubulin.
Figure 6.
Figure 6.
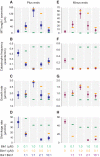
Combined effects of Bim1 and Bik1 on microtubule dynamics. (A–H) Sea urchin axonemes were incubated with 11.5 μM tubulin in the presence of varying concentrations of both Bim1 and Bik1. Parameters of microtubule dynamic instability were determined as in Figure 5 (see Supplemental Table 4). Error bars, ±SD. For comparison, the orange and green bars indicate the individual effects of Bim1 (orange) or Bik1 (green) at the concentration indicated, as previously shown in Figures 4B and , A–F.
Figure 7.
Figure 7.
Working model for the effects of Bim1, Bik1, and the Bim1-Bik1 complex on microtubule dynamics. (A) Bim1 binding to microtubule plus ends may stabilize lateral associations between protofilaments and promote growth. A similar activity could inhibit catastrophes by preventing the protofilament peeling that accompanies microtubule depolymerization. (B) Bik1 promotes the oligomerization of tubulin subunits. Assuming that these tubulin oligomers cannot be incorporated into microtubules, their formation will lower the effective tubulin concentration, inhibiting microtubule growth and increasing catastrophe frequency. (C) In the Bim1-Bik1 complex, the N-terminal CH domain of Bim1 is free to bind microtubule plus ends and affects microtubule dynamics in much the same way as Bim1 alone. On the other hand, the N-terminal CAP-Gly domain of Bik1 is bound to the C-terminal tail of Bim1 and is unable to interact with tubulin. It is possible that in vivo Bim1 is used to recruit Bik1 to the microtubule plus end, and an additional factor is needed to bring about the transfer of Bik1 from Bim1 to the microtubule (blue arrow).

Similar articles

Cited by

References

    1. Akhmanova A., Hoogenraad C. C. Microtubule plus-end-tracking proteins: mechanisms and functions. Curr. Opin. Cell Biol. 2005;1:47–54. - PubMed
    1. Akhmanova A., Steinmetz M. O. Tracking the ends: a dynamic protein network controls the fate of microtubule tips. Nat. Rev. Mol. Cell Biol. 2008;4:309–322. - PubMed
    1. Al-Bassam J., van Breugel M., Harrison S. C., Hyman A. Stu2p binds tubulin and undergoes an open-to-closed conformational change. J. Cell Biol. 2006;7:1009–1022. - PMC - PubMed
    1. Arnal I., Heichette C., Diamantopoulos G. S., Chretien D. CLIP-170/tubulin-curved oligomers coassemble at microtubule ends and promote rescues. Curr. Biol. 2004;23:2086–2095. - PubMed
    1. Badin-Larcon A. C., Boscheron C., Soleilhac J. M., Piel M., Mann C., Denarier E., Fourest-Lieuvin A., Lafanechere L., Bornens M., Job D. Suppression of nuclear oscillations in Saccharomyces cerevisiae expressing Glu tubulin. Proc. Natl. Acad. Sci. USA. 2004;15:5577–5582. - PMC - PubMed

Publication types

MeSH terms